

Welcome to Bristlemoon Capital! We have written previously on M, Google’s ROI, ASML, IFX GY, AERO SW, AER, ADBE, TDG, the AI bubble, FICO, GOOGL, ASML, SNPS, UNH, META, GRND, HEM SS, MELI, U, APP, PDD, IBKR, PAR, AER, PINS, BROS, MTCH, CPRT, RH, EYE, and TTD.
If you haven’t subscribed, you can join 6,450 others who enjoy our deep dives and investment insights here:
Wholesale investors looking to invest in the Bristlemoon Global Fund can do so via this link.
Sandisk held its 2026 Investor Day earlier this month and, in our view, there were three main takeaways: 1) management provided additional color on its New Business Model (NBM) agreements; 2) the 2030 outlook for AI DC bit demand and workload mix; and 3) most importantly, an FY28-FY30 long-term financial model. The company also presented a section on its High Bandwidth Flash (HBF) initiative, but this seemed more like a marketing piece than something that is ready for widespread industry adoption within the next few years.
In this short note, we want to focus on the FY28-FY30 financial model in the context of Sandisk’s NBMs. In our opinion, what looks like a picture of stability on the surface is, upon deeper inspection, a more mixed outlook than what management probably intended to communicate. Considering the stock initially pumped over 40% post-Investor Day and has since given up more than half of those gains, it seems like the market has come around to a more skeptical interpretation of that outlook.
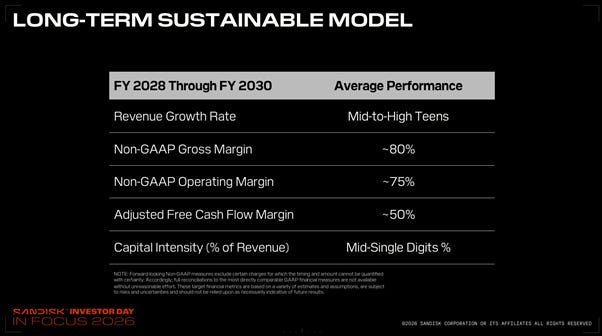
Source: Sandisk 2026 Investor Day
Before diving into the long-term model, we must acknowledge that no one, management included, can predict with confidence what the NAND cycle will look like 3 to 4 years out. The extreme historical cyclicality coupled with the pace at which AI is evolving makes this a largely futile task, at least as far as point estimates are concerned.
The memory and storage vendors are currently taking advantage of the unprecedented pricing and shortage dynamics to try and break free from historical cyclicality through long term agreements (LTAs) with strategic customers (e.g. Sandisk’s NBMs). Whether these LTAs work this time remains to be seen, and obviously the base rate of LTAs working in any highly cyclical industry is close to zero.
Source: Sandisk Q4 FY2026 presentation
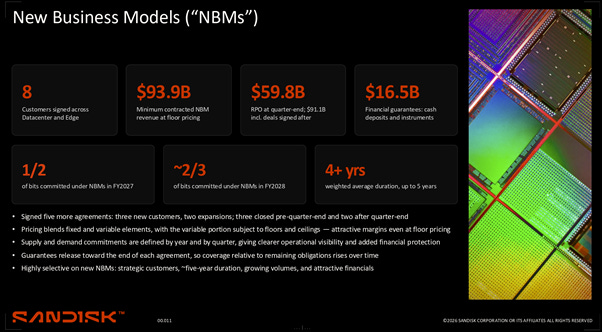
Sandisk has signed NBMs with 8 strategic customers for a minimum contracted revenue of $94 billion over 4 years at floor prices. These agreements have a combination of fixed and variable (floor and ceiling) pricing and volume commitments that grow over the 4-year weighted average duration. Approximately half of FY27 bits and two-thirds of FY28 bits are covered by NBMs, potentially rising higher if additional NBMs are signed.

Source: Bristlemoon Capital
Based on these parameters, we estimate that the minimum contracted revenue is ~$14B in FY27 for the 50% of bits under NBM, or ~$28B total revenue. 4Q26 annual run rate revenue was $36B, which likely grows to $38-39B assuming FY27 bits (we estimate +7-8% above 4Q26 bits) and flat ASP. This suggests that the NBM floor price is 26-28% below the realized 4Q26 ASP and a gross margin floor of 78-79% given the 4Q26 gross margin of 84.6%. CFO Luis Visoso confirmed at the Investor Day that the NBMs had a floor gross margin of “around 80%”, so we can be reasonably confident that the NBM floor price is mid-to-high 20% below the current ASP.
When we compare these numbers to the long-term model, we start noticing some…inconsistencies. Management says the company will adhere to mid-high teens annual bit growth with discipline to avoid oversupplying the market. This implies the mid-high teens revenue growth rate in the FY28-FY30 model is driven by bit growth only, with ASP staying flat on average.
However, the ~80% average gross margin is only plausible if ASP falls by over 30% from today’s levels, after accounting for annual bit cost downs (an aside: the company no longer discloses the cost down cadence to dissuade customers from feeling entitled to sharing in the cost savings…). The only way to reconcile this 80% average gross margin with flat ASP in the model is for gross margin to enter the FY28-FY30 period at 80% - i.e. blended ASP falls to NBM floor levels (or below) by FY28 and the FY28-FY30 “sustainable model” essentially becomes a bet that the NBMs hold water in an oversupplied market.
One might argue that an 80% average margin over 3 years could still mean stable ASPs and an 84% margin in FY28, but that would require subsequent margins to fall below the 80% NBM floor – either a direct repudiation of the effectiveness of the NBMs, or non-NBM ASP and margins crash so hard that one must question why hyperscale customers are eagerly signing 4-5 year LTAs in the first place if prices are expected to crash within the next two years.
Seeing how unlikely it is that the above message is what management intended to communicate, there is only one interpretation that makes sense to us: the long-term model as presented is a piece of investor marketing material that should be de-emphasized because actual performance will either be better or materially worse. If NAND supply/demand remains in deficit through FY28, there is no reason to believe that gross margin wouldn’t remain in the mid-80s range. If bit supply does move into surplus, it is very unlikely that ASP declines stop at the NBM floor. Historically during downcycles, NAND ASPs would decline much more violently, and the starting point this time is extreme to say the least.
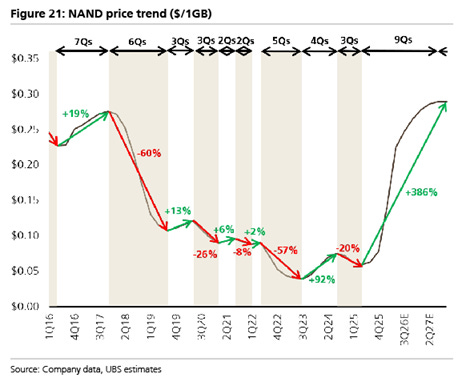
Looking at sellside supply/demand models, it appears that a ~MSD% bit deficit has been sufficient to push NAND ASPs up four-fold over the past year. Conversely, a MSD% bit surplus could in theory drive a similar collapse in ASP. For investors, this extreme level of price sensitivity to small mismatches in supply and demand make it almost impossible to forecast industry supply and demand with any degree of confidence, as the error bars alone are enough to drive multiples-higher or lower changes in ASP.
What we can do instead is model some scenarios where supply growth in excess of demand leads to sharp declines in ASP, and the impact that has on revenue, margins and earnings.
The first scenario below assumes an acceleration of bit supply beyond management’s mid-high teens target drives NBM ASP down to the floor and non-NBM ASP down -50% by 4Q29 compared to 4Q26 (June 2026). This results in gross margin falling to 78% in FY29 and EPS of $218.
The second scenario assumes that NBMs are breached and both NBM and non-NBM ASP fall -50% vs 4Q26. This compresses gross margin further to 72% and EPS to $154.


Source: Bristlemoon Capital, company filings
What is the appropriate P/E multiple to pay for these earnings following a -60% to -65% peak-to-trough decline in ASP? For cyclical stocks, trough earnings typically coincide with peak(ish) multiples as the market starts pricing in the next upcycle. An 8x multiple – just one turn above Sandisk’s current 7x forward P/E, is probably not unreasonable and suggests a “trough” share price range of $1,200 to $1,700 in mid-2028 vs $1,485 today.
For a truly disastrous outcome where FY29 EPS is sub-$100, ASP would have to fall something like -75% peak-to-trough, which is another 40% decline from the -60% peak-to-trough level. What industry conditions are required to precipitate such a collapse in ASP? We suspect it would require the combination of demand falling short against a very aggressive expansion of wafer capacity.
How likely is this to happen? We can’t forecast industry supply/demand with any reliable accuracy, but we are confident that agentic inference – namely KV cache offload and long horizon agentic memory – will be material and entirely incremental sources of NAND bit demand. Sandisk estimates a 1 ZB installed base of KV cache offload storage by 2030, which would absorb a high-teens percentage of industry bit supply over the next 4 years given current industry capacity of ~1.2 ZB and assuming high-teens bit supply growth. This is more aggressive than what we estimate, but we think KV cache offload and persistent agentic memory combined could drive an incremental mid-high teens annual bit demand. This also completely ignores storage for AI-generated video, which hasn’t taken off in the West (yet) but is certainly gaining popularity in China.
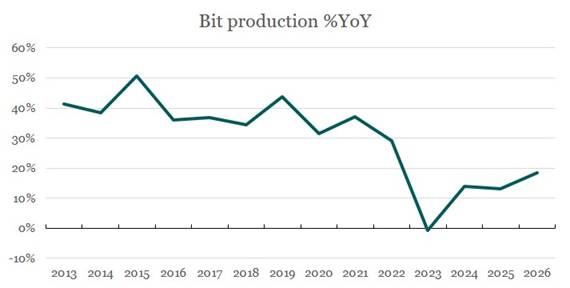
On the supply side, Sandisk is committed to mid-high teens bit growth – no more, no less. The other NAND incumbents have also found supply discipline following the severe 2022 downturn when NAND gross margins turned negative but may be losing that discipline in the face of the current severe supply/demand imbalance.
Source: Bristlemoon Capital, Bernstein
SK Hynix (50% expansion at Dalian), Samsung (Pyeongtaek P5) and Kioxia (Kitakami K3) have all recently announced NAND capacity expansions which will come online between 2027 and 2029+. The biggest wildcard is China’s YMTC, which currently has ~200kwpm capacity (~15% industry share) and plans to open three new 100kwpm predominantly NAND fabs on an undisclosed timeline (the first 50kwpm will be operational in 2027). 300kwpm would be a 20% increase in industry wafer capacity, which sounds like a lot but if spread over 5 years is only a ~4% annual increase. We think it is unlikely that existing high-teens bit production growth plus these new capacity additions will be sufficient to tip the market into oversupply within the next 2-3 years.
Disclaimer / Disclosures
The information contained in this article is not investment advice and is intended only for wholesale investors. All posts by Bristlemoon Capital are for informational purposes only. This article has been prepared without taking into account your particular circumstances, nor your investment objectives and needs. This article does not constitute personal investment advice and you should not rely on it as such. This document does not contain all of the information that may be required to evaluate an investment in any of the securities featured in the document. We recommend that you obtain independent financial advice before you make investment decisions.
Forward-looking statements are based on current information available to the author, expectations, estimates, projections and assumptions as to future matters. Forward-looking statements are subject to risks, uncertainties and other known and unknown factors and variables, which may affect the accuracy of any forward-looking statement. No guarantee is made in relation to future performance, results or other events.
We make no representation and give no warranties regarding the accuracy, reliability, completeness or suitability of the information contained in this document. To the maximum extent permitted by law, we do not have any liability for any loss or damage suffered or incurred by any person in connection with this document.
Bristlemoon Capital Pty Ltd (ABN: 22 668 652 926) is an Australian Financial Services Licensee (AFSL Number: 552045).
George Hadjia and Daniel Wu are associated with Bristlemoon Capital Pty Ltd. Bristlemoon Capital may invest in securities featured in this newsletter from time to time.