
Google’s AI Return on Investment
Why the market is underestimating Google's AI returns

Welcome to Bristlemoon Capital! We have written previously on ASML, IFX GY, AERO SW, AER, ADBE, TDG, the AI bubble, FICO, GOOGL, ASML, SNPS, UNH, META, GRND, HEM SS, MELI, U, APP, PDD, IBKR, PAR, AER, PINS, BROS, MTCH, CPRT, RH, EYE, and TTD.
If you haven’t subscribed, you can join 6,296 others who enjoy our deep dives and investment insights here:
Wholesale investors looking to invest in the Bristlemoon Global Fund can do so via this link.
In recent months, the market has become increasingly concerned about the amount of AI capex being spent and the capex spenders’ ability to earn a return on their investment. The hyperscalers are on track to spend over $750 billion in capex this calendar year, and well over $1 trillion next year once sellside update their capex estimates following Q2 earnings season. Management teams continue to reiterate their qualitatively bullish expectations for ROI but remain unwilling or unable to quantify the returns they expect from these monumental investments. So, unsurprisingly, the stock prices of these capex upgraders have come under mounting pressure, and they are no longer being rewarded for earnings beats.
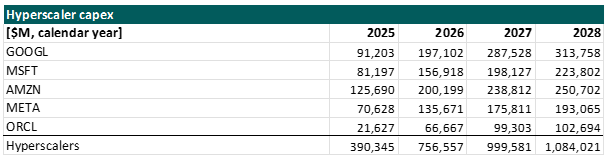
Source: Bloomberg consensus estimates. Note Amazon includes capex for the retail business in addition to AWS
The common refrain we see and hear is that there’s no way the hyperscalers can earn an acceptable return on $1 trillion a year of AI capex, and skeptics will point to the current pace of capex outlay and ask “well, where are the returns?!” Indeed, a naïve view of the financials supports this skepticism.
Using Alphabet (henceforth Google) as an example, the company has spent $132 billion in capex in the LTM to June 2026, while LTM operating income has increased by $26 billion. This equates to a 16% post-tax incremental ROIC – still above the company’s cost of capital, but a far cry from the asset-light growth engine it once was.
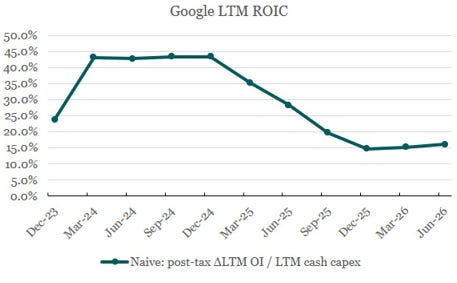
Source: Bristlemoon Capital, company filings
We would argue that the above naïve interpretation of ROIC is way off the mark. To understand why, one must realize that not all the capex outlay in a period is placed into service immediately, and obviously assets that are purchased but not yet tested, commissioned and placed into service are not generating any revenues. Therefore, while Google spent $132 billion on capex LTM, we estimate that only $82 billion was placed into service, or $57 billion net of depreciation.
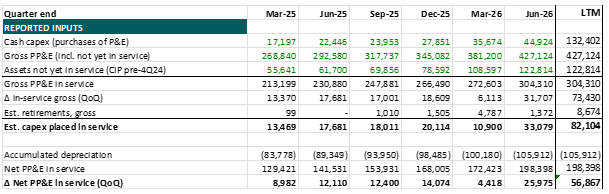
Source: Bristlemoon Capital, company filings
If we use the change in average, instead of period-end, net PP&E in service, the $57 billion falls to $43 billion, which in our opinion is the correct denominator to use for calculating Google’s LTM incremental ROIC. This works out to be 49% post-tax compared to just 16% for the naïve calculation. From this perspective, it is perhaps easier to understand why the hyperscaler management teams remain so bullish about their AI capex investments.

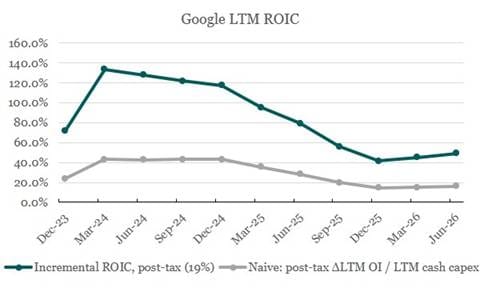
Source: Bristlemoon Capital, company filings
While it is undeniably true that Google’s returns have declined over recent years (though note 2024 was flattered by easy comps coming out of a tough H2 2022-H1 2023), a ~50% incremental ROIC is still extremely healthy for a business of this size, and reinvesting as much as Google is. It is also notable that incremental ROIC troughed in Q4 2025 and has expanded the past two quarters even as quarterly capex has nominally increased.
Finally, there is an interesting question for the finance theory nerds: would you rather own a business with 120% incremental ROIC and 10% reinvestment rate, or a business with 50% incremental ROIC but 100% reinvestment rate? Holding all other assumptions about the future constant (big if – we’ll revisit that), it should be pretty evident which business will produce the better long-term future return for owners.
On the topic of future returns…

Thus far, we’ve been looking backwards at Google’s ROIC as it ramped up its AI investments. Turning to the future, we have $123 billion in assets not yet in service sitting on the balance sheet. The not yet in service backlog has averaged around four quarters over the past three years, so we can expect that $123 billion (or ~$110 billion net of ~10% depreciation rate) will be placed into service by Q2 2027. We will use pre-tax ROIC here to make it easier to compare to Bloomberg operating profit consensus, but essentially: if we assume Google maintains the 60% incremental ROIC it achieved LTM to Q2 2026 and places all $110 billion of existing net capex into service by Q2 2027, its NTM operating income should increase by over $60 billion.
This is well ahead of current Bloomberg consensus, which has operating income increasing by $43 billion over the NTM and incremental ROIC falling to the low-40s (our estimate). More importantly, it also doesn’t include any operating income uplift from i) additional assets placed into service from NTM capex, ii) TPU hardware sales, which the CFO has said will be material in 2027, and iii) any earnings from the $920 million-per-month compute rental deal with SpaceX, which Google would not have signed if it were not extremely constrained on compute.

Source: Bristlemoon Capital, Bloomberg consensus
Now, we acknowledge that the assumption that Google can maintain 60% or even 50% incremental returns as it deploys well over $100 billion in assets over the next year is carrying a lot of weight in the above analysis. Certainly, part of the rising capex is memory price inflation, which is essentially a tax that drags on incremental returns unless GCP can pass that cost entirely onto customers. Even if we assume $10 billion of the assets not yet in service is unproductive memory inflation, it will only reduce incremental returns by mid-single-digits, and evidently management sees enough upside to continue ramping investments notwithstanding extreme hardware inflation.
The greater uncertainty, and clearly the key piece of the entire ROI puzzle, is where token demand caps out. Hyperscalers have emphatically claimed that demand for compute exceeds available supply, but we cannot infer from that alone the delta between demand and supply. If demand for frontier intelligence is truly unlimited (we don’t think it is), Google should have no trouble sustaining or even expanding its 60% incremental ROIC as it brings hundreds of billions of compute assets online.
Realistically, the relationship between token demand and supply is likely to be very fluid and highly price elastic, especially for near-frontier intelligence. As such, we have no idea where token demand might start to asymptote. Our high-level inference analysis suggests that frontier flagship model API pricing (5.6 Sol or Fable) generates gross margins in the 90s – plausibly in the high 90s – and smaller more cost-effective models are still delivering extremely attractive inference economics.
If broader compute availability puts pressure on token pricing, we believe pricing can come down significantly while still allowing for very good returns on the compute investment. For example, at 98% gross margin, API pricing can halve and GM will only fall to 96%, while the resulting increase in token demand can still drive healthy gross profit dollar growth. In such a world, incremental return on compute investment need not even come down if hardware and software efficiencies combine to enable multiple-fold increases in token throughput.
In any case, Google placed an estimated $33 billion of assets into service in Q2, so we will all find out soon enough what kind of incremental return that can earn!
Disclaimer / Disclosures
The information contained in this article is not investment advice and is intended only for wholesale investors. All posts by Bristlemoon Capital are for informational purposes only. This article has been prepared without taking into account your particular circumstances, nor your investment objectives and needs. This article does not constitute personal investment advice and you should not rely on it as such. This document does not contain all of the information that may be required to evaluate an investment in any of the securities featured in the document. We recommend that you obtain independent financial advice before you make investment decisions.
Forward-looking statements are based on current information available to the author, expectations, estimates, projections and assumptions as to future matters. Forward-looking statements are subject to risks, uncertainties and other known and unknown factors and variables, which may affect the accuracy of any forward-looking statement. No guarantee is made in relation to future performance, results or other events.
We make no representation and give no warranties regarding the accuracy, reliability, completeness or suitability of the information contained in this document. To the maximum extent permitted by law, we do not have any liability for any loss or damage suffered or incurred by any person in connection with this document.
Bristlemoon Capital Pty Ltd (ABN: 22 668 652 926) is an Australian Financial Services Licensee (AFSL Number: 552045).
George Hadjia and Daniel Wu are associated with Bristlemoon Capital Pty Ltd. Bristlemoon Capital may invest in securities featured in this newsletter from time to time.
Thank you, very interesting. I made a similar exercise taking SpaceX Colossus 1 as example. Using neocloud on-demand prices I got decent ROIC 25-45% depending on the capex assumptions. I agree with you that Alphabet is in a strong position even if token prices will decline. They have structural cost advantage (TPUs, cost of capital, scale) and funding capacity to outcompete pretty much everyone.