
The Trucking Bottleneck
Why shrinking truckload capacity could turn a modest demand recovery into a freight-rate squeeze

Welcome to Bristlemoon Capital! We have written previously on IFX GY, AERO SW, AER, ADBE, TDG, the AI bubble, FICO, GOOGL, ASML, SNPS, UNH, META, GRND, HEM SS, MELI, U, APP, PDD, IBKR, PAR, AER, PINS, BROS, MTCH, CPRT, RH, EYE, and TTD.
If you haven’t subscribed, you can join 6,190 others who enjoy our deep dives and investment insights here:
Australian wholesale investors looking to invest in the Bristlemoon Global Fund can do so via this link.
Introduction
While the US trucking industry is likely considered outside the purview of investors seeking to invest in high-quality compounder businesses (it’s too cyclical and competitive), our experience is that a lot of opportunities (both long and short) tend to present when there are turning points in the US transportation market. After all, physical goods still need to move across the US economy, and shifts in transportation costs can have meaningful second-order effects on the margins of the companies that produce, distribute and sell them.
It is thus worth diving into some recent developments in the US transport and logistics industry that are causing trucking spot rates to skyrocket. Since late 2025, there has been a revenue per mile (RPM) rally, with ex-fuel van spot rates increasing by around 30% year-over-year (YoY) in May 2026, which followed increases of 11%, 23%, 20%, and 25% across January to April. This is the strongest stretch of performance since 2021.
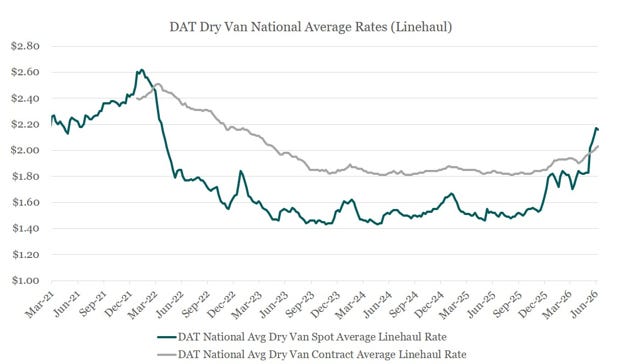
Source: Bristlemoon Capital, DAT Solutions, Bloomberg
Notably these increases in trucking spot rates are excluding fuel surcharges (ex-fuel rates are referred to as “linehaul” rates). When we include the 60-70 cents of fuel surcharges that have been tacked onto trucking rates since March 2026, then all-in spot rates have been increasing at an almost 50% YoY clip in the recent weeks of June 2026.
For any company that needs to move goods, a 50% increase in the rate you’re paying to transport those items versus the year prior is clearly meaningful, so it’s worth us digging into what has caused this material spike in spot rates.
Some background on the trucking cycle
Before we look into what has catalyzed the current transportation market tightness, it is worth rewinding and looking at developments in the last few years that have affected the US trucking space, particularly as they relate to the level of trucking capacity.
During the pandemic years, there was a notable uptick in new active carriers in the US. There was a spike in demand for transporting goods (goods spending surged, inventories were rebuilt, and e-commerce volumes accelerated). This led to a sharp uptick in spot rates that created unusually attractive economics for owner-operators. This triggered a major wave of new carrier formation, with many new carriers popping up to take advantage of that heightened demand and elevated spot rates.
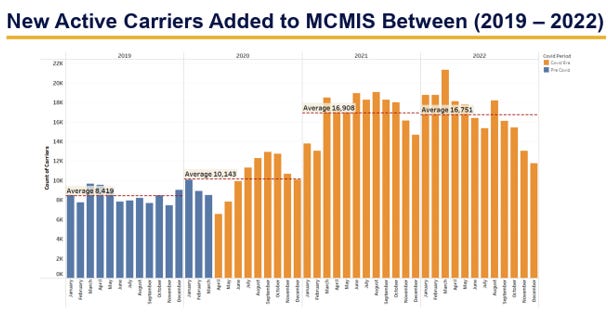
Source: Motor Carrier Management System (MCMS) Data Snapshot via FMCSA
However, it is the nature of the capacity added during that period which is noteworthy. If we look at the table below, we can observe that 65-72% of the truck carrier capacity being added in any given year during the pandemic period was from one-truck operators. And there was an 11.5 percentage point increase in the mix of new carriers added coming from one-truck operators in 2022 compared to 2019. It was a freight goldrush of sorts.
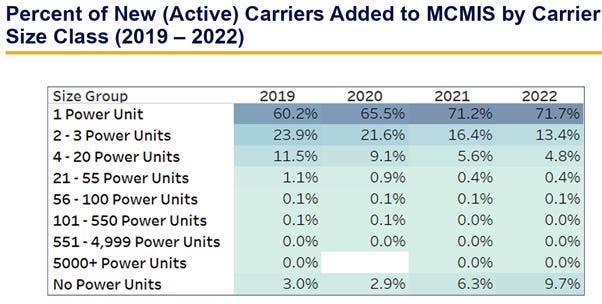
Source: Motor Carrier Management System (MCMS) Data Snapshot via FMCSA
But in 2022 the cycle started to turn. Goods demand normalized, retailers moved from restocking to destocking, and spot rates began falling. In fact, DAT dry van national average linehaul rates declined from above $2.60 per mile in January 2022 to below $1.60 in November 2022, a 40% decrease in less than a year. In other words, there was too much trucking capacity for the shrinking level of freight demand, and the spot rates swiftly deflated to reflect this.
The downturn then became self-reinforcing. Spot rates fell below many small carriers’ economic cost of operating. And this was all while diesel, insurance, maintenance and financing costs remained elevated. Carriers that had bought equipment at peak prices during the pandemic frenzy were squeezed by falling revenue per mile and higher debt service. This led to trucking capacity exiting the market.
But it’s worth pointing out that while carrier capacity was quick to be added, this capacity was slow to exit, as many operators kept operating to generate cash, even at poor margins. Our belief is that this dynamic helped keep rates depressed for longer than in a normal cycle, and it was a grueling three year trucking bear market.
If we look at the Cass Freight Index that tracks the movement of goods by any mode of transportation, the index has suffered 40 consecutive months of YoY declines.
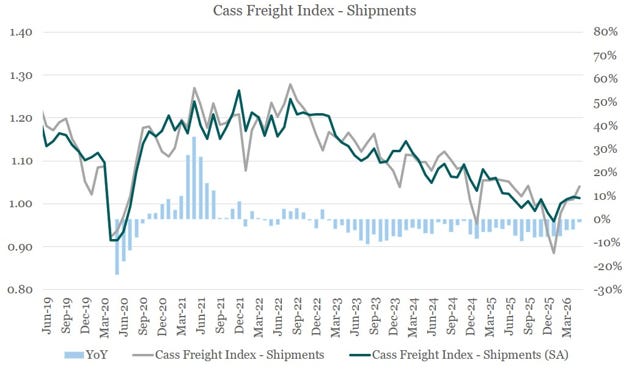
Source: Bristlemoon Capital; Cass Information Systems
This is notable, as we’ve been seeing enormous increases in trucking spot rates even with freight demand remaining weak. And this is due to some recent regulatory changes in the market that have led to further carrier exits.