
UnitedHealth Group (UNH) and the US Healthcare System
A primer on the U.S. healthcare system

Welcome to Bristlemoon Capital! We have written previously on GRND, HEM SS, MELI, U, APP, PDD, IBKR, PAR, AER, PINS, BROS, MTCH, CPRT, RH, EYE, TTD, and META. If you haven’t subscribed, you can join 4,478 others who enjoy our deep dives and investment insights here:
Free subscribers will only receive a partial preview of our reports. The remainder of our reports, which contain the deeper analysis, are reserved for paid subscribers. Consider becoming a paid subscriber for full access to our reports.
Bristlemoon readers can also enjoy a free trial of the Tegus expert call library via this link.
Australian wholesale investors looking to invest in the Bristlemoon Global Fund can do so via this link.
Table of Contents
Introduction to US healthcare system
US healthcare expenditure
Participants in the US healthcare system
Health insurance in the United States
The rise of managed care
Medicare
Medicare Advantage
Medicaid and other safety net programs
Employer-sponsored health insurance
Economics of managed care
UnitedHealth Group and its place in the US healthcare system
UnitedHealthcare
OptumHealth and value-based care
OptumRx and pharmacy benefit managers
OptumInsight
What went wrong in 2025 (so far)?
Regulatory risks
What does the path to recovery look like?
Introduction to the US healthcare system
The US healthcare system is a complex, multi-payer system where healthcare is provided by a mix of for-profit and nonprofit providers, and paid for by a combination of government programs, private insurance, and out-of-pocket payments. Unlike many other developed nations, the US does not have universal coverage, which means its citizens do not have guaranteed access to healthcare. Despite the lack of universal coverage, the US spends more on healthcare on an absolute and per-capita basis than any other country. This has enabled a (formerly) $1+ trillion market cap industry to coalesce around the provision of healthcare services in the US, and directly supports the multi-trillion market cap pharmaceutical, biotech and medical devices industries.
We acknowledge at the outset that the state of the US healthcare system is a politically and often emotionally charged topic. It is not our intention in this deep dive to make normative statements about the perceived or actual political, economic and social shortcomings of the US healthcare system. We simply explore the system as it is and aim to provide factual analysis – this “primer”, if we may, is not so much for the benefit of the reader but rather for ourselves.
We have historically dismissed the US healthcare system as a bit of a black box and largely relegated it to the “too hard” basket. However, with the unprecedented implosion of UnitedHealth Group (UNH), the largest private player in the industry, we decided it was finally worthwhile investing the time (and collateral brain damage) necessary to better understand the US healthcare services space. If, ultimately, this space remains in our too hard basket, it will not be for lack of trying.
In attempting to understand the healthcare services industry, we center our analysis on UNH, in part because there may be opportunity in the brutal selloff, and partly because UNH’s operations are so expansive as to cover health insurance (aka managed care), healthcare provider, pharmacy benefit manager (PBM), and healthcare IT services. It seems logical to us to cover as much ground as possible with one stock.
US healthcare expenditure
According to the Centers for Medicare and Medicaid Services (CMS), US national health expenditure was $4.9 trillion in 2023 or 18% of US GDP. Healthcare expenditure has grown substantially faster than CPI, driven by medical cost inflation and an ageing population.
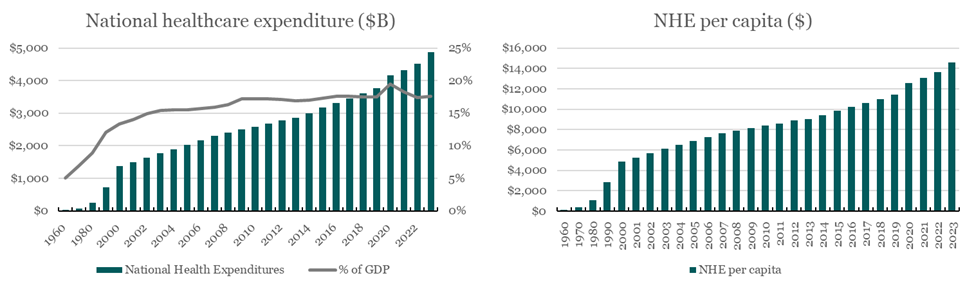
Source: Bristlemoon Capital, CMS data
Per capita healthcare spend of $146 in 1960 has expanded 100x to $14,570 per person in 2023 and is approximately double the OECD average on a PPP-adjusted basis.

Source: KFF
In terms of where the expenditure goes, inpatient hospital care is the largest category at nearly one third of total healthcare spend. Outpatient physician services is the second largest category at 20% and retail prescription drugs is the third largest category at 9%. There is a perception that US healthcare spending is driven by out-of-control drug costs, which is not immediately evident in the data. However, we have heard that total expenditure can alternatively be decomposed into roughly one-third each of inpatient (hospital settings), outpatient (clinic/other settings) and drug spend, as the CMS data below allocates drug spend by setting e.g. hospital drug infusions are included in hospital care.
As for expenditure by payer, government programs are the largest source of funding at nearly half of total healthcare spending. These include Medicare, Medicaid and other safety net programs (federal and state), military-related programs and public health initiatives. Private insurance is predominantly employer-sponsored health insurance, with a small portion of individually purchased insurance mainly on the health exchanges established by the Affordable Care Act (ACA). Finally, patients spend over $500 billion on out-of-pocket expenses, though we believe this mainly reflects deductibles, copays and coinsurance rather than the healthcare spend of the uninsured.
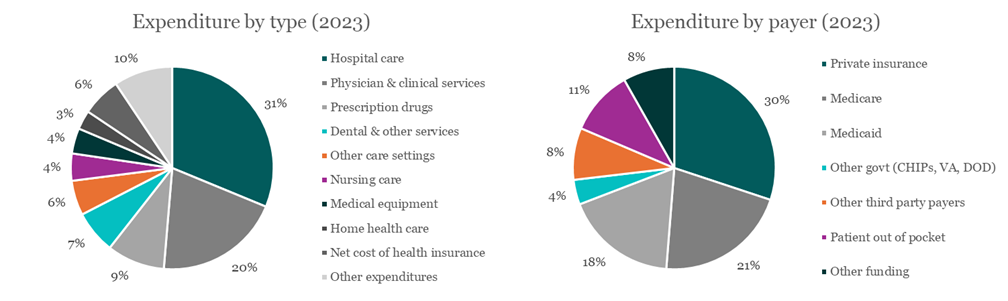
Source: Bristlemoon Capital, CMS data
Participants in the US healthcare system
We summarize below the key participants in the US healthcare system:
Consumers – the 340 million US population are the primary consumers of healthcare. Approximately half of the population is covered by employer sponsored health insurance, either as direct beneficiaries or dependents. 8% of the population is uninsured, down from the mid-teens post-GFC following the passage of the ACA, which expanded the Medicaid program and established the ACA exchanges for individual health insurance. The remainder of the population is covered by some form of government sponsored program, whether for the elderly (Medicare) or the various safety net programs of which Medicaid is by far the largest.
Payers – the payers in the system fall under three broad categories: the government, employers, and individuals. Note that the US does not have a single payer healthcare system, unlike Canada, the UK, and Australia among other countries. The government only acts as single payer for the elderly and through safety net programs.
Managed care organizations (MCO) – MCOs are the health insurers and as their name suggests, their role is to manage the cost and utilization of healthcare, ostensibly to maximize health outcomes and minimize total healthcare expenditures. MCOs design health plans (health insurance policies), collect premiums from the payers and establish networks of providers where they can offer volume in exchange for lower cost of care. There are a handful of large national MCOs of which UnitedHealthcare is the largest, regional and state MCOs including the nonprofit Blue Cross Blue Shield companies, and integrated health systems such as Kaiser Permanente that control health plans, hospitals and primary care groups.
Healthcare providers – providers are the organizations that provide healthcare services to patients. These include hospitals, primary care clinics and physician offices, ambulatory surgical centers, behavioral health centers, nursing facilities and home care among many other care settings. Typically, “inpatient” refers to hospital care, while “outpatient” refers to all non-hospital care settings. This distinction is important when it comes to insurance coverage and fee schedules for medical procedures (inpatient typically being more expensive than outpatient).
Pharmacy benefit managers (PBM) – PBMs are the middlemen in the prescription drug supply chain, connecting drug manufacturers with retail and specialty pharmacies – not physically, but financially. PBMs play an important role in drug price setting, create the formularies that define which drugs are available at which pharmacy networks under which health plans, reimburse pharmacies for prescriptions filled, and generally exert influence over prescription drug consumption in the US. The PBM model is opaque even by healthcare standards, and there is long-running controversy surrounding their pricing practices. President Trump has singled out PBM reform as a means to lower prescription drug prices for Americans. We will discuss PBMs in much more detail later as it is an important component of UNH’s model.
Suppliers – suppliers into the healthcare system include drug manufacturers, drug distributors, medical device makers, medical consumables, and healthcare IT service providers. These participants are outside the scope of this deep dive, though we may revisit some of these industries in the future.
Health insurance in the United States
The current design of the US health insurance industry can trace its origins back to the Great Depression and WWII era. It was during this time that the original nonprofit Blue Cross (hospital cover) and Blue Shield (physician cover) health plans were created to help pay for rising healthcare costs. During WWII, wage controls were legislated to stabilize prices and contain inflation, but employers were allowed to offer up to 5% of employee wages as fringe benefits. The IRS ruled that employee health benefits were a tax-deductible expense, and this gave rise to employer-sponsored health insurance. By 1960, over half of the US population was covered by employer-sponsored insurance, a share that has remained relatively stable to this day.[1]
In 1965, Medicare and Medicaid were created under President Lyndon B Johnson’s Great Society program. With employed Americans and their dependents largely covered by employer-sponsored insurance, there was a pressing need to address healthcare gaps for the elderly and the poor/unemployed. Medicare was created as a federal government single payer program for people aged 65 and over, while Medicaid would be a state and federal-funded safety net program for those living at or below the federal poverty line.
These early programs were essentially traditional forms of indemnity insurance - i.e. the insured would incur a cost and the insurer would cover or indemnify that cost. While these programs socialized the burden of healthcare costs, they did little to contain healthcare cost inflation.
The rise of managed care
The highly inflationary decades from 1965 through the mid-1980s saw a blowout of healthcare costs. According to CMS data, national health expenditure (NHE) grew at a CAGR of 11%, 13% and 11% in the 1960s, 70s and 80s respectively, such that NHE per capita grew twenty-fold from 1960 to 1990. For comparison, NHE per capita has increased five-fold in the 33 years since 1990.
Several legislative developments through these decades were aimed at bringing healthcare costs under control. The Health Maintenance Organization Act of 1973 was passed to facilitate the establishment of Health Maintenance Organizations (HMO), a type of health plan that combined prepaid monthly premiums with care delivery through a narrow network of healthcare providers. The motivation behind the HMO model was to contain medical costs through fixed payments (known as capitation), funnel volume through a narrow network of providers at lower cost, and engage in utilization management strategies such as prior authorizations and tight network coverage. HMOs disrupted conventional indemnity-style health insurance and spawned further permutations of the model, such as Preferred Provider Organizations (PPO) which are more flexible with out-of-network providers and may not require referrals for specialists, but come with higher premiums, copays and out of pocket limits.
On the government program side, the Tax Equity and Fiscal Responsibility Act of 1982 authorized Medicare to enter into risk-based contracts with HMOs and other private health plans. The shift towards risk-based contracts, where health plans receive a capitated payment per member per month (PMPM) and are at risk for cost overruns, was aimed at reducing Medicare’s ballooning costs. Subsequently, the Balanced Budget Act of 1997 introduced Medicare+Choice (later renamed to Medicare Part C), which sought to offer Medicare beneficiaries access to more private health plans with more comprehensive benefits, thereby incenting them to move off traditional fee-for-service Medicare. The Medicare Modernization Act of 2003 renamed Part C to Medicare Advantage (MA), further expanded plan options for beneficiaries, and established the Medicare Part D prescription drug benefit for both traditional Medicare and MA.
During the 1990s, industry consolidation was also taking place due to the disruption wrought by HMOs, PPOs, and the necessity of scale to effectively manage healthcare costs, especially under risk-based models. Cost containment by payers directly translates to lower revenues for providers, so the healthcare provider market also saw a wave of horizontal and vertical consolidation, ultimately resulting in the large health systems that exist today. Provider consolidation begot further insurer consolidation, as relative bargaining power determined which party got to keep more of the pool of healthcare expenditure.
In the late 1990s, UnitedHealthcare, then a health plan rollup, began acquiring healthcare technology services, and by the early 2000s also began to acquire specialty services, physicians’ practices, and a PBM to boot. The other large, listed insurers eventually began to replicate UNH’s vertical integration strategy by acquiring care providers of their own, giving rise to today’s integrated managed care organization model.
But before we can unpack the economics of managed care, we need to understand the three main funding programs for the healthcare system: Medicare, Medicaid and Commercial (aka employer-sponsored).
Medicare
Medicare is the federal government-funded health insurance program for US residents aged 65 or older or are disabled. Medicare consists of four parts: A, B, C and D.
Part A provides hospital insurance (typically for free)
Part B provides medical insurance for outpatient settings e.g. primary care physician visits (typically for a monthly premium, $185 in 2025)
Part C is Medicare Advantage as discussed previously
Part D is the prescription drug benefit established by the MMA (typically for a ~$45 monthly premium)
Original/Traditional Medicare consists of Parts A and B and is a fee-for-service (FFS) model administered by the CMS whereby the government will pay healthcare providers for medical services rendered, without a cap. Medicare beneficiaries must meet an annual deductible before insurance kicks in and are then subject to 20% coinsurance on all medical costs (uncapped). Beneficiaries can take out separate MediGap insurance to cap their annual out-of-pocket (OOP) expenses. Part D had an OOP maximum of $8,000 per year that was reduced to $2,000 by the Inflation Reduction Act, starting in 2025.
Medicare Advantage
In the context of MCOs, our interest lies in Medicare Advantage, as that is the managed care version of Medicare. MA plans must cover everything that is covered under Original Medicare, but can also provide supplementary benefits such as dental, vision, fitness etc., and increasingly, quality of life benefits such as transportation and grocery cards. MA members must still pay the Part B and Part D premiums, though some plans apply their benefits to help cover part or all of these premiums. MA plans typically do not require the 20% coinsurance under Original Medicare, have lower copays for cost sharing, and have capped OOP expenses ($9,350 maximum for 2025). The main drawback of MA is a limited provider network and tighter utilization management per the earlier HMO/PPO discussion, compared to Original Medicare where beneficiaries can visit any provider for any service that accepts Medicare.
Evidently, the attractiveness of supplementary benefits and capped OOP costs far outweigh the drawbacks, as MA has seen significant enrollment growth over the past two decades. MA members account for substantially all new enrollment into the broader Medicare program essentially since MA’s inception, and has now exceeded 50% of the eligible Medicare population. The MA program has been a crucial growth driver for many MCOs, particularly UNH and Humana (HUM) who together have enrolled over 45% of total MA members and historically traded at premium multiples to other listed MCOs. Given the last of the baby boomers will turn 65 by 2030, there are a few more years of favorable demographic tailwinds for the MA insurers. However, recent changes to how CMS calculates MA rates, and the risk of future tightening have made the MA program less attractive than in the past.
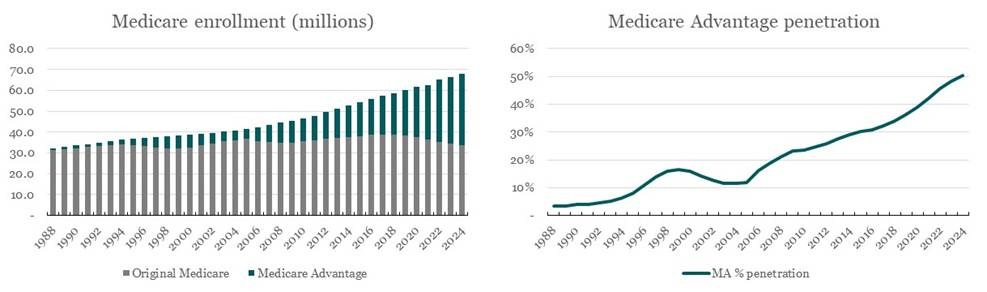
Source: Bristlemoon Capital, CMS data
Medicare Advantage rate setting process
The CMS sets the PMPM benchmark payment for MA plans on an annual cadence based on the growth in per-capita FFS Medicare costs, further adjusted by several factors to better align the MA population with the FFS population. The CMS releases its MA rate-setting Advance Notice in early January for the following year (i.e. January 2025 for 2026 rates), and publishes the final Rate Announcement by early April. MA plans then have until early June to submit their bids for the following year.
We present below the year-over-year change in MA benchmark rates for the past several years.

First, we provide a brief explanation of each material rate component:
Effective growth rate – this is the estimated growth rate of per-capita FFS Medicare spend based on observed trends through rate Year minus 2 (i.e. the rate announcement for 2026 is published in April 2025 using actual 2024 data) and actuarial projections. This means MA payment rates always lag actual medical cost trend. In an environment where medical costs and utilization are rising, MA plans will face challenges containing their medical costs within the confines of their capitated payments from CMS. We can see for payment year 2024, the effective growth rate was only 2% due to favorable FFS cost trends in 2021 and 2022. We, and the entire MA industry, are not clear why the 2025 effective growth rate was equally low, considering the rising utilization that MA plans began to experience starting in 2023. This resulted in MA-reliant MCO stocks, particularly Humana, suffering steep drawdowns. CMS seems to have now realized its underestimation of utilization, resulting in a sharp increase in the 2026 rate announcement.
Change in Star Ratings – MA plans are assigned star ratings under the Quality Bonus Program which we discuss below. The brief summary is that plans rated 4.5 or 5 stars receive a 5% increase to their benchmark rate. The change in star ratings reflects the impact on benchmark payments from the average increase or decrease in star ratings.
Risk model revision and FFS normalization – the MA benchmark PMPM payment is scaled by a risk adjustment factor for each member. We discuss the process of coding and risk adjustment in detail below, but this factor essentially reflects CMS’s attempt to align the risk scores of the MA population with that of the FFS population. CMS is well aware that MA plans are incentivized to code their members more intensively to receive higher risk-adjusted PMPM payments. CMS risk adjustment models have a base year e.g. 2015 or 2019 where the average risk score is 1.0 which then inflates over time; the FFS normalization factor is intended to reset each payment year to an average score of 1.0. For years 2018 to 2023, the negative adjustment mainly reflected the FFS normalization with marginally positive risk model revisions. For payment year 2024, CMS introduced a new risk adjustment model V28 intended to further curtail MA coding intensity. V28 will be phased in over three years and is expected to reduce risk scores (and thus benchmark payments) by up to 8%.[2]
Change in benchmark rate – this is the net impact of the above adjustments and reflects the “like for like” change in benchmark payments to MA plans, i.e. assuming no change to average risk scores. CMS then estimates an “MA coding trend adjustment” which recognizes that risk scores do in fact inflate over time as MA plans are incentivized to code their members with as many diagnoses as they can to receive higher risk-adjusted payments.
Expected MA payment trend – this is the growth in total MA PMPM expenditure that CMS expects to fund. MA plans of course claim that the MA coding trend adjustment is merely remuneration for sicker members and not a true increase in MA program funding. When MCOs and industry lobbies complain about funding shortfalls, they point to the proposed change in benchmark rate; when CMS pushes back, it points to the expected MA payment trend.
Benchmarks, bidding and rebates
As outlined above, CMS sets the benchmark PMPM rates for the MA program. While the rate announcement is a single set of numbers reflecting the national program average, CMS actually sets individual county-level benchmark rates. These represent the maximum rates that CMS will pay in each county for a plan member of average health (risk score 1.0). Every year in June, plans submit their bids for MA contracts. Bids below the benchmark rate will receive a rebate equal to a percentage of the difference between the bid and the benchmark. Bids above the benchmark will receive the maximum benchmark rate and must charge plan members an additional premium for the difference.
These benchmark rates can be increased by a number of adjustment factors, the main two being a county quartile adjustment and the star quality bonus. Because benchmarks are set based on per-capita FFS spending, counties in the lowest quartile of FFS spending receive a benchmark set at 115% of FFS, while counties in the highest quartile of spending have a reduced benchmark at 95% of FFS.
The star quality bonus falls under the MA Quality Bonus Program (QBP) established by the ACA. MA plans are assessed across 40+ quality rating measures and assigned a star rating from 1 to 5. The intention of the QBP is to incentivize MA plans to improve quality and member experience by awarding plans rated 4 stars or higher a bonus 5% increase to their benchmarks. Rebate levels are also determined by star rating, with 4.5-5 star plans receiving a 70% rebate, 3.5-4 star plans receiving 65% rebate and 3 star or lower plans receiving 50% rebate.

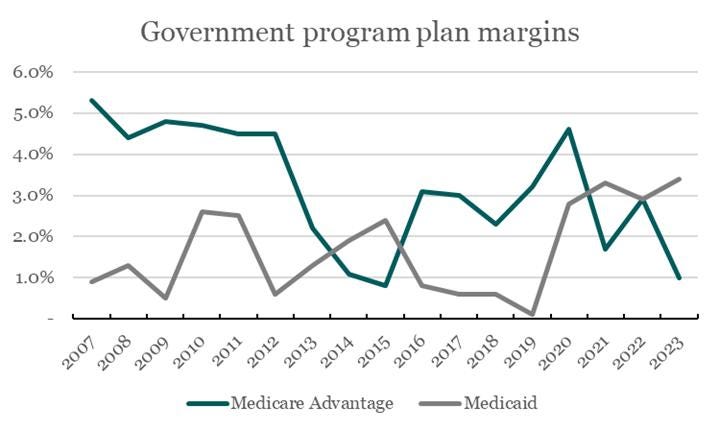
MA plan profit margins tend to bounce around 3%, so it is quite evident how important star ratings are to the financial performance of a plan. A 4.5 star plan can bid against a 5% higher benchmark, which translates to a 3.5% rebate – essentially the entire profit of the plan. Of course, MA plans are required by law to apply all rebates to the benefit of its members, whether through supplemental benefits, premium buydowns or other forms of reduced cost sharing. Nonetheless, a 3.5% bonus rebate means a plan can offer 3.5% additional benefits without eroding its profit margin, making the plan more attractive to existing members and prospective enrollees. Losing the bonus can mean redesigning the plan to offer fewer benefits, a higher cost share burden for members, or exiting some markets entirely.
For the 2025 star ratings, which were released in October 2024 based on assessments conducted through 2023, CMS appears to have raised the star cutoff points by more than expected, resulting in multiple plans receiving material rating reductions, including the two largest plans from UnitedHealthcare and Humana. Humana in particular saw its average star rating fall from 4.37 in 2024 to 3.63 in 2025, essentially wiping out up to $3 billion in quality bonuses (Humana’s operating income was only $2.6 billion in 2024). Both UnitedHealthcare and Humana filed lawsuits against the HHS; the former won its claim to force CMS to recalculate its stars rating, while the latter litigation is still ongoing.
UNH is actually our second pick for a healthcare system deep dive. We were initially intrigued by HUM given the stock had sold off by over 50% from late 2023 to late 2024, with two distinct drawdowns – one in January 2024 following the CMS 2025 Advance Notice, and another in October 2024 following the 2025 star ratings. However, upon learning that bonus rebates were paid the year following the star rating, we were less enthused about the time it might take for Humana to return to its previous profitability levels. Considering Humana didn’t know about its stars implosion until October, it only had two months to implement widespread improvements for the 2024 assessment period that would determine the 2026 stars (to be paid in 2027). If that isn’t successful, it would have to try again in 2025 for the 2027 star ratings, and would not receive meaningful bonus payments until 2028!
Risk adjustment
Finally, we want to touch on the topic of risk adjustment. The CMS benchmark rate reflects the average health of the entire FFS Medicare population, and this imaginary beneficiary of average health is assigned a risk score of 1.0. Of course, some individuals will be sicker than others, and CMS will pay MA plans more for members with higher acuity, and less for healthy members with lower acuity. The process of scaling the PMPM payment to reflect the health of the individual member is known as risk adjustment.
When new members enroll in an MA plan, the plan doesn’t know anything about the member’s health status. The default PMPM payment the plan receives for these members is based solely on their demographics-only score, which reflects age, sex, disability status etc. It is then the plan’s responsibility to get these new members to see their primary care doctors for their annual checkups, so the plan can obtain clinical diagnoses for any conditions the members may have. CMS maintains an exhaustive database of health conditions known as the Hierarchical Condition Categories (HCC). Each health condition has a code, and each category of conditions is assigned a risk adjustment factor (RAF) score. These new members thus get “coded”, and the plan submits these diagnostic codes to the CMS to update the members’ risk scores. The default PMPM payment is then multiplied by the total RAF to calculate the risk-adjusted payment.
Risk adjustment is a practice that is highly susceptible to abuse due to capitation. CMS and its advisory bodies (e.g. MedPAC) have found that the risk scores of MA populations tend to be higher than FFS Medicare, thereby costing taxpayers more. In theory, seeing as MA and Original Medicare represent ~50/50 of the eligible Medicare population, both population pools should be statistically significant samples of the overall Medicare population, and one should not be persistently sicker than the other. As expected, competing partisan interests have different explanations for this risk score discrepancy.
MA advocates argue that higher average risk scores are due to higher coding intensity – i.e. MA plans are more proactive in identifying and thus managing medical conditions, which ultimately reduces total medical costs in the long run. Detractors argue that plans are incentivized to “upcode” – the practice of diagnosing conditions that might not be supported by clinical evidence – because higher risk scores lead to higher capitated payments from CMS and more profit for the MA plans.
It is worth highlighting that V28, CMS’s latest risk adjustment model that is being phased in through 2024-2026, has made significant changes to the HCC, eliminating or consolidating a number of conditions and remapping RAF scores. As we mentioned in passing earlier, this is expected to have up to an 8% impact on risk scores upon full phase-in. This is one of the Biden administration’s more prominent attempts to crack down on risk adjustment profiteering in the MA program. CMS maintains that the current model will reflect more recent utilization trends, costs and diagnostic patterns, leading to less overpayments. The model is also expected to more closely align the coding intensity of MA plans with that of FFS Medicare.
The table below provides a stylized example of the impact of V28 vs the previous V24 risk adjustment model. This is likely on the more extreme end with the person’s total risk score declining by -33%. Note that the default demographic factor for this person is 0.737.

Source: https://www.agshealth.com/blog/understanding-the-changes-in-the-cms-hcc-model-v28/
Putting all of the above together, the chart below summarizes how MA payments are calculated.

Source: MedPAC
Medicaid and other safety net programs
We now turn briefly to Medicaid and other safety net programs such as the Children’s Health Insurance Program (CHIP), which at the cost of over $900 billion, represents almost as much healthcare expenditure as Medicare. Medicaid was originally established in 1965 alongside Medicare to provide insurance for people living below the federal poverty line (FPL). The program has seen multiple expansions, including CHIP during the Clinton era and by the ACA under Obama, which raised the eligibility threshold to 138% of the FPL. The ACA also established public health insurance exchanges (aka Marketplace) to provide subsidized insurance for individuals who did not qualify for any other programs.
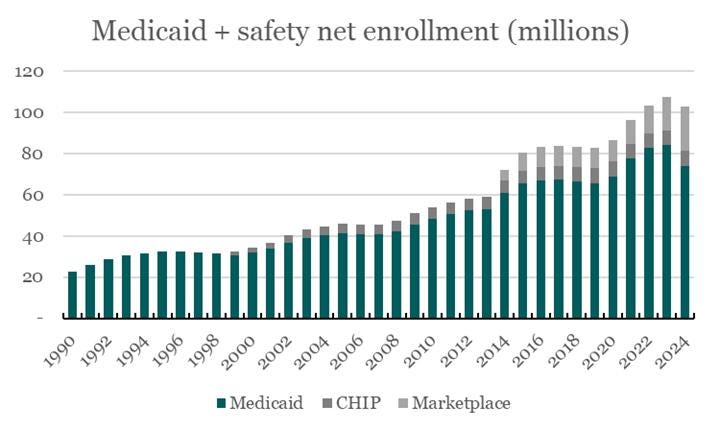
Source: Bristlemoon Capital, CMS data
The Medicaid program is administered by the states but jointly funded by state and federal governments. Federal funding ranges from 50-80% of total funding and varies by state, with poorer states receiving more federal funding. The funding is actually on a matched basis – for every $1 the state spends, the federal government matches by some multiple. Similar to Medicare Advantage, some states have elected to outsource their Medicaid programs to private MCOs, on a similar PMPM capitation basis. However, unlike MA which typically lets plans keep the savings they generate and reinvest back into plan benefits (and plan profits), states typically adjust capitation payments annually to recapture some or all of those cost savings. This is because as a safety net program, there is already de minimis cost sharing with Medicaid beneficiaries, and no incentive to provide supplemental benefits beyond basic medical care.

Source: KFF
Consequently, in our opinion, managed Medicaid is a less attractive business for MCOs than MA. Medicaid growth over the decades has largely come from program expansion rather than favorable demographic tailwinds as is the case for MA. MA has higher premium, higher acuity (more opportunities for cost containment), more flexible plan design (more opportunities for cost containment), and historically higher plan margins.
Source: Bristlemoon Capital, Bernstein
In recent years, Medicaid plans have enjoyed abnormally high profit margins due to the COVID public health emergency (PHE), which mandated continuous enrollment for Medicaid beneficiaries in addition to a temporary 6% increase in Federal funding. What usually happens is that each year, Medicaid beneficiaries are assessed for eligibility and disenrolled if they are no longer eligible. Disenrollment was paused during the PHE, which resulted in Medicaid enrollees jumping from ~66 million in the five years through 2019 to 94 million at the peak in March 2023. Following the expiration of the PHE, Medicaid redeterminations resumed in April 2023 and has resulted in ~15 million people being disenrolled through the end of 2024. So Medicaid MCOs, especially Molina and Centene, enjoyed additional payments for otherwise ineligible members, and lower utilization during the 2021-2023 period.
Conversely, as we explained in the MA rate setting section, MA plans faced lower like-for-like PMPM payments for 2024 and 2025 while utilization rates surged, resulting in severe margin contraction. The MA-heavy MCOs are arguably still recovering from this today, and the higher rates announced for 2026 should help. We’d also note that the MA plan margin compression in 2013-2015 was largely due to the ACA cutting MA benchmark rates to 1) fund the ACA Medicaid Expansion and 2) to bring MA payments closer to FFS Medicare costs. MA payments were already seen as excessive back then, so the current media attention on MA risk coding is nothing new.
This brings us to the final reason why we think the Medicaid business is less attractive than MA – regulatory risk. Both Medicaid and MA face regulatory scrutiny, but Medicaid has historically been subject to far more sustained federal scrutiny and threats of funding cuts.
This is because:
The federal government has limited control over funding due to the state matching requirement (which states can abuse);
The over-65s are the most consequential voter demographic so cutting their entitlements is a political non-starter; and
Republicans tend to see the Medicaid program as a form of open-ended government welfare.
The 3rd point is especially relevant today given full GOP control of Congress. The House reconciliation bill currently working its way through Congress threatens to cut federal Medicaid funding by up to $880 billion over ten years, impose 80-hour per month work requirements as part of eligibility criteria (currently zero), and require semi-annual eligibility verification, amongst other proposed changes. In the lead up to the House bill, there was also discussion about potentially converting federal Medicaid funding to block grants – essentially fixed lump-sum or PMPM payments to the states – from the open-ended matching model that exists today.
Employer-sponsored health insurance
The last of the three main funding programs is employer-sponsored insurance (ESI), also known as commercial insurance. Here, employers contract with MCOs/health plans to provide health insurance to their employees. This can either be done on a “risk” basis aka Commercial Risk whereby the employer pays a fixed premium and the insurer takes on the risk of funding medical benefits, or on a self-insured basis aka Commercial ASO where the employer bears the funding risk and pays the insurer a fee for administrative services only e.g. care coordination, claims processing and access to the insurer’s provider network. Typically, large employers with diversified risk pools will choose to self-insure while smaller employers will opt for commercial risk insurance.
We don’t have much to say about employer-sponsored insurance as this is the most straightforward and least controversial “program”. Premiums are negotiated and set between private parties, contracts can be repriced to reflect actual realized utilization and medical cost trends, and funding is not a political debate. ESI is the most mature health insurance market and enrollment has remained stable in the 160-180 million range for decades. Competition between plans largely falls along the vectors of lower per-unit medical costs or better cost management. The Blue Cross Blue Shield plans tend to have the highest enrollment in any given state and can leverage their scale to negotiate the highest discounts from healthcare providers. Smaller for-profit MCOs might not be able to secure the best discounts (even UnitedHealthcare is #2 in most states) but can engage in superior utilization management to achieve comparable total medical costs.
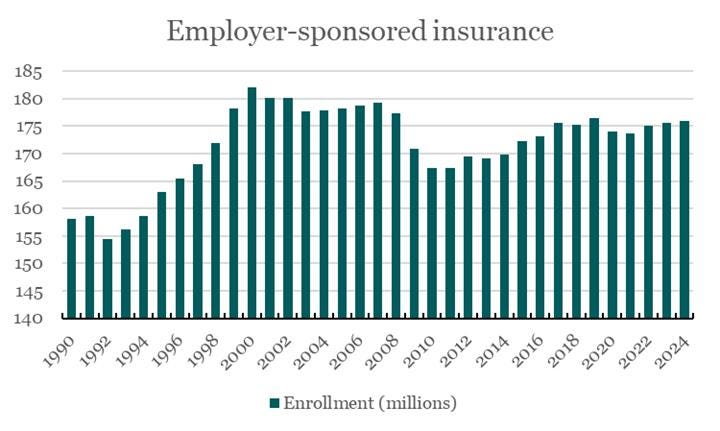
Source: Bristlemoon Capital, CMS data
From the perspective of the healthcare provider, there is a big difference between government and employer-sponsored insurance. For FFS Medicare, CMS sets the physician fee schedules and hospital reimbursement rates – there is no negotiating with the government. Medicaid reimbursement rates are typically lower than FFS Medicare due to it being a safety net program for the poor. MA plans, while serving the Medicare population, do negotiate rates with providers, and these rates tend to be even lower than FFS Medicare due to network concentration and risk-sharing arrangements. On the other hand, reimbursement rates for commercial/ESI tend to be much higher, sometimes multiples higher, than government rates for the same procedures.
Economics of managed care
A concise textbook definition of “insurance” would be a policy that is intended to protect against unexpected loss. Health insurance, like other forms of insurance, is a means of socializing the burden of catastrophic loss. However, one unique feature of health insurance is that unlike almost all other forms of insurance, a health insurance policy is designed to be used frequently. We don’t buy car insurance with the intention of crashing our car every year, but we buy health insurance with the intention of availing ourselves of doctor visits, dentist checkups and prescription drugs. In a sense, a health insurance policy can be thought of as a discount card to access healthcare services. Readers in the US are probably familiar with the cost delta between an in-network doctor’s visit and an out-of-network visit.
This unique feature of health insurance has implications for insurer behavior. If you’ve ever wondered why companies such as Travelers or Progressive are known as P&C insurers but the Elevances and Humanas of the world are referred to as managed care organizations, then you are a) a nerd, but b) an astute one. Underwriters of “traditional” forms of insurance typically price their policies ex-ante based on actuarial factors and once issued, have little ability to “steer” the behavior of the insured. Sure, the policy might contain exclusions for intentional damage and unlawful behavior (e.g. driving under the influence), but the primary avenue of loss mitigation is claims adjudication after a loss event has occurred, and secondly by increasing future premiums to try and recover excessive prior year losses.
Health insurers, on the other hand, receive capitated payments and are on the hook for potentially unlimited medical cost. It is much easier for a health plan member to unintentionally and without malice overconsume healthcare services than it is for a P&C policyholder to have their house burn down multiple times a year. As such, the primary role of MCOs is in the name – to manage the (medical) care of its plan members by balancing the outcomes/quality of care with the cost of care.
We can decompose the total cost of medical care into a classic P x Q equation: the cost per unit of care, and the number of units consumed. The cost per unit of care is typically set within the contracts between the MCO and its network of healthcare providers, or in the case of Medicare and Medicaid, set by the government. The cost per unit is easier for the MCO to predict because it is contractually negotiated and can typically be priced into the plan premium ahead of time. The number of units consumed is also known as utilization and is influenced by factors such as members’ underlying health status (vs what’s been priced, especially for MA), more physician visits, higher incidence of seasonal illnesses, higher-acuity hospital stays, increased prescription drug use etc. Utilization is much harder to predict and can improve/deteriorate throughout the year, so MCOs spend a lot of time trying to manage utilization. Overall medical cost inflation or medical cost trend is the combination of unit cost inflation and changes in utilization.
The best MCOs from a shareholder perspective tend to be the ones that can consistently predict (and price for) their medical costs and effectively manage plan utilization in line with those predicted costs. Below, we highlight some of the main strategies that MCOs use to manage their medical cost trends.
Network design – starting at the top, plans need to decide if they want a wide or narrow network of providers. If plans can direct higher volumes of patients to a narrower network of physicians, hospitals, pharmacies etc, they can negotiate steeper per-unit discounts with these providers. The tradeoff is a more restrictive network for plan members and higher OOP costs for out-of-network services.
Benefit design – MCOs can also design plan benefits and costs to incentivize certain behavior e.g. higher copays or coinsurance to steer members away from certain services or higher cost care settings, or inclusion of supplemental benefits like certain testing, screening or even acupuncture if there is evidence such benefits reduce overall cost of care.
Utilization management – in addition to using OOP costs to disincentivize unnecessary care consumption, MCOs try to steer patients to lower-cost care settings e.g. outpatient surgical center for hip replacement instead of an inpatient hospital stay. MCOs also use prior authorizations to limit medically unnecessary specialist visits and medical procedures, case management programs for members with comorbidities, step therapy protocols especially for prescription drugs, and claim denials at the extreme. Some of these utilization management techniques are seen as controversial (essentially denial of care) and are a source of the recent public backlash against MCOs.
Risk sharing and value-based care – just as MA is a risk-based arrangement between CMS and private MCOs, MCOs can also enter risk-sharing or value-based arrangements with care providers. We will explore value-based care in the next section.
In terms of the economics of an MCO, the two most important metrics are premiums and the Medical Loss Ratio (MLR). Premiums are the revenues that MCOs collect from payers – for government programs it will be based on their bids relative to benchmarks and the change in those benchmarks as determined by CMS, and for commercial programs it is directly negotiated with the payers (predominantly employers). The MLR is the totality of medical costs incurred by the MCO’s members as a percentage of the premiums collected. A listed MCO’s primary objective is to contain its medical costs within the bounds of its premium revenue to generate a profit for shareholders. A lower MLR indicates the MCO is effectively managing its medical costs, while a higher MLR, especially over 90% (let alone 100%) suggests the MCO is struggling to contain its medical cost trends.
But an MLR that is too low is also not ideal as it suggests the MCO is either overearning on premiums or not providing sufficient benefits to members/excessively denying care, neither of which are sustainable. The ACA established a minimum MLR floor of 80% for individual and small group markets and 85% for large group and MA. Hence, we typically see employer focused MCOs (e.g. Cigna) running at low-80s MLRs and MA/Medicaid focused MCOs (e.g. Humana, Molina) running in the high-80s range, with more diversified players somewhere in the middle.

Source: Tegus. MRQ = most recent quarter. Note CVS (Aetna) is missing due to its large retail pharmacy operation.
The listed MCOs run at operating cost ratios in the high-single digit to mid-teens range as a percentage of revenue, although direct comparability is difficult as these companies tend to also have material non-insurance operations. Putting the MLR and operating cost ratios together, the big listed MCOs achieve operating margins in the low- to mid-single digit range for their insurance businesses. Given these thin margins, we can understand why their earnings are so sensitive to changes in capitation rates and utilization.

Source: Tegus
This concludes the payer and MCO sections of this primer. For paid subscribers, we will cover the two remaining major system participants – the providers and PBMs – more specifically in the context of UNH below. This means we will omit hospital providers because they are not relevant to UNH’s business, but may revisit them in future considering hospital care accounts for the largest percentage of US healthcare expenditures.