Table of Contents
Online Dating Background
The Genesis of Match Group
The Tinder Cash Cow
Match Group Business Overview
Business Quality – Key Issues
Low user information density
High levels of user churn
Reputational issues
Management turmoil
User demographic constraints
The Future of Match Group
Extracting more value from power users
Pricing-led growth is great if you can get it
Hinge – stealing the show
Upside optionality from App Store fee changes
Valuation
Key Takeaways
Match Group is a holding company of online dating apps. MTCH’s brands are incredibly dominant: more than 50% of relationships that start on a dating app/site begin on a Match Group brand.
Tinder, which comprises the majority of MTCH’s earnings, is now raising prices and rearchitecting their subscription plans (introduction of weekly subscriptions as well as an imminent super-premium tier that monetizes power users) after a period of falling behind on price increases relative to competitors. Bumble’s average revenue per paying user is 87% higher than Tinder’s. The large pricing difference bodes well for Tinder’s ability to raise prices and at the recent Citi conference, the CFO said Tinder was going to hit double-digit top-line growth a quarter earlier than previously expected, indicating good traction with these initiatives.
Hinge growth is accelerating, and the $400m FY23 revenue guide implies the business will hit a 50% Q4 revenue growth exit rate. As Hinge becomes an increasingly large value driver (within five years Hinge is likely to be contributing >80% of incremental MTCH revenue dollars and at improved margins), the narrative is likely to shift away from the mature Tinder cash cow towards the more promising, high growth Hinge asset. The greenfield geographic expansion opportunity (Hinge is in just 20 countries compared to Tinder in 200) and a product that’s resonating with daters could see Hinge become a greater than $1 billion top-line business alone.
Almost 70% of MTCH’s COGS are paid to the Apple and Android app stores via in app purchase fees. Recent legislation and litigation are putting pressure on these internet gatekeepers to lower their take rate which could result in a 9 ppt one-time margin boost for MTCH.
MTCH trades at 14x forward earnings and an 8% FCF yield, despite accelerating business metrics. We can reasonably underwrite $5.80/sh in FY27 FCF, implying a 14% IRR and 2x MOIC. Under a bull case scenario where app store fee relief is granted, MTCH could achieve a 31% IRR over the next 5 years, a 3.8x MOIC.
Online Dating Background
“Dating” means different things to different people. It could be serious or casual. Short-term or long-term. Monogamous or open. Straight or gay. However, at its core, dating involves two people coming into contact and interacting. The process of finding that person has historically been hyperlocal. Aziz Ansari, in his book Modern Romance, interviewed a swath of seniors in a New York retirement home. Astonishingly, over one-third of those interviewees met their spouses within a block or two of their childhood home. This revelation extends beyond the anecdotal accounts of these New York seniors.
A 1932 study by Brossard examined the addresses found on 5,000 Philadelphia marriage licenses, showing that one-sixth of the couples lived within a block of one another, one-third lived within five blocks, and 51.9% lived within twenty blocks of each other. With numerous technological advancements in the interim since that study – cars, planes, and most importantly, smartphones – there has been a proliferation of dating options that has complicated and irrevocably changed the dating landscape. The Internet, and the subsequent emergence of online dating, has been a key contributor to that tectonic shift.
Online dating dissolved the historical propinquity that characterized dating for centuries – that is, the physical proximity that would nurture kinship. Suddenly people had access to dating prospects from all over the globe, no longer bound by the need to physically approach someone to start an interaction. It was 1995 when the world’s first online dating website, Match.com, was launched. The site was open to anyone over 18 years old with an email address. It heralded a step change in the experience of searching for a mate.
Dating on the Internet obviated the need to frequent dingy clubs in the wee hours of the morning, risking cold, hard rejection from a would-be companion. Rather, rejection in the online sphere was silent and unfelt. Better still, the search could be undertaken in your pajamas from the comfort of your own home. The genius of Match.com was that it addressed the pitfalls and inefficiencies of dating in the analog world; social shyness, fear of rejection, and the need for physical proximity melted away as impediments to starting an interaction. The follow-on effects from what Match.com started were profound. Nowadays, according to Match Group, 40% of all relationships in the U.S. start online and 1/3 of marriages begin on an app.
The Genesis of Match Group
Match.com was revolutionary: not only did it wildly expand the market for dating candidates, but it also allowed searches to be filtered based on selected criteria. Co-founder of Match.com, Gary Kremen, was obsessed with data. He would provide users with a questionnaire, with granular and occasionally bizarre questions, where the output was used to pair users based on their preferences.[1] Never had a data-driven approach to dating been married with the scale of the internet. The results were impressive. Within a year and a half, Match.com had 100,000 registrations[2].
The website monetized its users by charging a monthly subscription fee, with discounts for longer-term subscriptions. In 1997 Match.com was acquired by Cendant, who later sold the business to USA Networks Inc. (later renamed IAC) on June 14, 1999 for a total purchase price of $43.3 million (interestingly, the entity within USA Networks Inc. that purchased Match.com was Ticketmaster Inc.). At the time it was purchased by IAC, Match.com had more than four million user registrations and approximately 560,000 active users[3]. Below is a snapshot of what the Match.com user interface looked like.
Source: LowEndMac
Within the fold of IAC, Match.com was joined by a range of other online dating properties which IAC purchased. IAC had a reputation for being a highly acquisitive holding company. Its playbook was to buy and build up companies before spinning them off. The brainchild of billionaire media mogul, Barry Diller, IAC was a hodgepodge assortment of media assets which over time came to include Ticketmaster (later spun off by IAC as a standalone entity in 2008 and then merged with Live Nation in 2010), Expedia, Angi’s List, Lending Tree, Investopedia, and many others. The strategy was very successful, generating immense value for IAC shareholders when incorporating the value from these distributed assets.
Match Group was incorporated in February 2009, combining all the dating properties that IAC had acquired. Match Group then completed its initial public offering on November 19, 2015 – it listed for $12.00 per share. On December 19, 2019, Match Group and IAC entered into a Transaction Agreement to split into two, separate public companies. The separation was completed on July 1, 2020. Barry Diller, Chairman of IAC, commented on the transaction: “We’ve long said IAC is the 'anti-conglomerate' – we’re not empire builders”. It is helpful to understand this history of how Match Group came about, particularly the acquisitive growth that resulted in dozens of dating properties being housed within the group.
Match Group Business Overview
Match Group, as we have explored, is a portfolio holding company that owns online dating assets. Its dating brands are extremely dominant, with more than 50% of relationships that start on a dating site/app beginning on a Match Group brand[4]. The company earns the vast majority of its revenue directly from users in the form of recurring subscriptions and, to a lesser extent, à la carte purchases. Subscriptions enable users to access various features for a specified period of time. This might include unlimited likes, no advertisements, or the ability to “passport” to another location. Below are the Tinder subscription tiers and the benefits you get by purchasing a subscription.
Source: Tinder
Source: Tinder
Users may still use flagship apps such as Tinder for free, but their experience will be hindered by limits on the number of profiles you can interact with, amongst other curtailments designed to push users to upgrade from free to a paid subscription. À la carte purchases involve the unbundling of these subscription packages, allowing users to purchase additional units of features such as “super likes” and “boosts”, etc. Below are some details on some of the most popular a la carte features:
Super Likes (~$3 each) – helps you stand out by prioritizing your profile for the person you’ve sent it to.
Boost ($6-8 each) – allows you to be one of the top profiles in your area for 30 minutes, increasing your chances of getting a match via an up to 10x boost to your profile views.
Super Boost ($40+ each) – similar to Boost but can get a user up to 100x more potential matches.
In addition to the forms of direct revenue discussed above, Match Group also receives a much smaller percentage of its revenue from indirect revenue sources, namely advertising revenue.
Match Group’s portfolio of brands includes Tinder, Hinge, Match, Meetic, OkCupid, Pairs, Plenty Of Fish, The League, Azar, Hakuna, and others. Below is a logo summary of key Match Group dating apps:
While Match has a lot of dating brands, Tinder is what really matters for this business, given that Tinder direct revenues comprise 56% of Match’s total revenue (FY22). Tinder is the most downloaded dating app worldwide as well as the #1 grossing lifestyle app overall worldwide[5]. Hinge is a distant second within the Match Group stable of brands, with its direct revenue making up 9% of consolidated revenues. It’s worth noting that Tinder’s scale means that it enjoys very high margins, resulting in an even greater portion of Match’s earnings deriving from Tinder. For these reasons, much of the focus of the analysis will be on Tinder and Hinge.
The Tinder Cash Cow
Tinder uses a double opt-in matching system, whereby both users must like each other in order to exchange messages. Users “swipe right” to like a user’s profile, or “swipe left” to reject that profile. The original prototype for Tinder was developed by Sean Rad and Joe Munoz at a hackathon held at the Hatch Labs incubator in West Hollywood in 2012. Some fun trivia: Hatch Labs was launched by IAC in 2011, meaning that IAC incubated Tinder from the beginning before ultimately acquiring it in 2017[6]. Later in 2012, Rad and co-founders Justin Mateen and Whitney Wolfe soft-launched Tinder in the App Store.
Tinder developed a frictionless onboarding system that abandoned the filling out of forms that characterized previous online dating services. Rather, new users could simply login with their Facebook profile and then could start swiping on user profiles. This enabled viral growth that was unprecedented for a dating app. The growth hack to supercharge Tinder’s early user growth was by visiting college campuses and recruiting students to the app. In an interview with Bloomberg, Tinder’s technical co-founder Joe Munoz explained:
[Whitney Wolfe] would go to chapters of her sorority, do her presentation, and have all the girls at the meetings install the app. Then she’d go to the corresponding brother fraternity — they’d open the app and see all these cute girls they knew.
Tinder started off with less than 5,000 students before Wolfe embarked on her college recruiting trip and had around 15,000 by the time she returned. The growth that followed over the ensuing years was astronomical. After just two years, Tinder was racking up 1 billion swipes per day and 12 million matches per day[7]. Tinder was rumored at the time to be approaching 50 million active users[8]. Users were logging into Tinder on average 11 times per day, spending up to 90 minutes each day on the app[9]. In 2017 Tinder became the highest grossing app on the Apple App Store[10]. That is wild. Tinder was making more money from iOS users than popular apps such as Candy Crush and Netflix.
Source: Insider via Apple
A corollary of this early virality is that Tinder could grow at a breakneck pace and spend de minimis on marketing. While this is coveted growth, it has created issues that Match Group is currently grappling with (we will explore these later). Below is a snapshot of the Tinder app:
Source: TechCrunch via Tinder
Tinder’s revenues have grown strongly at a 22% CAGR over the last four years (note that the 100% YoY Tinder revenue increase in 2018 stems from acquisition timing, with Tinder merging with IAC in July 2017 such that Match Group recognized only a partial year of Tinder revenue in 2017).
Source: Bristlemoon Capital; Company filings
While a 22% revenue CAGR is nothing to scoff at, the growth trajectory has markedly slowed, with just 9% YoY Tinder direct revenue growth in 2022. The numbers look much worse when we observe the rapid quarterly growth deceleration for Tinder. Tinder direct revenue was growing at north of 20% in 2021 before a dramatic deceleration to flat growth in 4Q23 and 1Q23. The most recent quarter (2Q23) has shown some life in Tinder direct revenues, growing 5.7% YoY.
Source: Bristlemoon Capital; Company filings
That’s a very ugly chart for a company’s revenue growth. Match Group investors who were underwriting the business as a 20% grower received a rude shock from the Tinder slowdown. The prospect of Match Group’s Tinder cash cow stalling created investor consternation, with the stock subsequently declining 83% peak-to-trough, falling from a high of $182 down to just under $31 per share.
Source: Koyfin (Bristlemoon readers can get 20% off a Koyfin subscription via this link)
So what’s going on at Tinder? Sensor Tower data has shown Tinder downloads to be declining over the last few years. This is at a time when other dating apps such as Bumble and Hinge are rapidly gaining users.
What is even more concerning is that the growth in the number of paying Tinder users has stalled. In fact, the number of Tinder payers has declined year-over-year for the last two consecutive quarters, with three consecutive quarters of sequential declines.
Source: Bristlemoon Capital; Company filings
Source: Bristlemoon Capital; Company filings
This signals deeper product issues that are causing users to churn and not reactivate, and/or would-be swipers to skip Tinder altogether in favor of other apps. We can think of Tinder’s userbase as a (very) leaky bucket, with water being poured in (new users/old users reactivating) and then leaking out of holes in the bucket (users that stop using the app and churn out of the service). Without series data for total Tinder users, we can look at the reported number of Tinder payers as a proxy for the well-being of the Tinder community (although this proxy has been weakened by recent developments around Tinder price increases and the introduction of weekly subscription tiers).
The declining number of Tinder payers we have observed in recent quarters is a red flag, signaling deteriorating health for the app. A former Match Group employee opined that both active users and payers were declining in tandem: “I think it's a combination both of active users that have been dipping and payers that have been just failing to resubscribe or failing to find a good option or not feeling that they're getting the value for what they're paying, and so just letting their subscriptions lapse”[11].
In the 2Q23 Match Group Shareholder Letter, there were some useful disclosures around Tinder Daily New Users. While still negative, there has been a sustained improvement in the trajectory of daily new Tinder users since February 2023. While we don’t know if there’s a base effect at play by lapping easy prior year comparisons, it’s encouraging that Tinder’s new campaign, It Starts with a Swipe™, is positively impacting Tinder’s new user trends. It was noted in the 2Q23 earnings result that Tinder is seeing a “significant increase” in both new user signups and reactivations in the U.S. and other key markets. Female users in particular have shown a “particularly notable improvement” in daily new user trends since the beginning of the year.
Source: Company filings
There are potentially several reasons for the issues that have been afflicting Tinder: 1) low user information density; 2) inherent churn hurts the LTV/CAC equation; 3) reputational damage; 4) management turmoil; and 5) user demographic constraints. We will explore these issues and assess the likelihood of Match Group’s management team being able to rectify these problems.
Low user information density
Easy onboarding of users is a double-edged sword for Tinder. On the one hand it enabled viral growth by removing sign-up frictions. On the other hand, faster onboarding also results in a lower information density for user profiles, given that there are less questions or prompts that can be used by Tinder to capture user information. On the 1Q23 call, it was mentioned that Tinder new user onboarding takes three to four minutes. At Hinge, the process can take more than 5x that, implying a 15–20-minute sign up time as users spend more time inputting information to complete their profiles. Below are the screens users progress through when signing up to Tinder for the first time.
Source: Tinder
The paucity of user information for Tinder users limits what the app can do to effectively match users to other users. A former Director of Corporate Strategy at Match Group articulated this conundrum for Tinder during a Tegus call:
there's a lot of user liquidity, but there's really nothing special about it, and you actually have to do a lot of work to find someone that might be in your preferences because Tinder doesn't have a good way to filter and people don't usually put a lot of information in their bios. So even though you can do some searching, it's not very effective.
The filtering options on Tinder are fairly basic. Users can filter profiles according to distance and age.
Source: Tinder
The filtering capabilities of Tinder pale in comparison to other apps that have filters allowing you to specify preferences regarding educational background, religion, political bent, family plans, drinking, smoking and drug use, and other personal attributes such as body type and ethnicity. Bumble, for example, allows for much greater filtering functionality once a user upgrades to a premium profile.
Source: Bumble
Low user information density is a problem because it hinders Tinder’s ability to curate user profiles. Without rich profile information, it becomes more difficult to show a user the profiles of other users they’re most likely to be interested in. This problem becomes even more pernicious as the platform scales. We can think of Tinder’s scale and unrivaled user liquidity as both a blessing and a curse. Having the most users on a dating platform holds immense promise that Tinder is the app where you will meet someone. The problem is that at some point the quality of incremental subscribers – that is, their attractiveness as dating candidates – degrades. That sounds harsh but the reality is that the majority of the population is unlikely to be of burning interest to the average dating app user. Jerry Seinfeld put it bluntly in the Seinfeld episode “The Wink” when he presented a rather downbeat assessment of the attractiveness of people:
Jerry Seinfeld : Elaine, what percentage of people would you say are good looking?
Elaine Benes : 25 percent.
Jerry Seinfeld : 25 percent, you say? No way! It's like 4 to 6 percent. It's a 20 to 1 shot.
Elaine Benes : You're way off.
Jerry Seinfeld : Way off? Have you been to the motor vehicle bureau? It's like a leper colony down there.
Elaine Benes : So what you are saying is that 90 to 95 percent of the population is undateable?
Jerry Seinfeld : UNDATEABLE!
Source: Seinfeld via IMBD
These real-world dynamics – that is, who we find attractive and the relatively small pool of people that fulfil these criteria – create problems for the scalability of a network business such as Tinder. The very best network businesses benefit from a long runway of increasing returns to scale. In other words, the network becomes stronger with each additional user that joins. This does not appear to be the case for Tinder or dating apps in general. Rather, there’s a point where the network effects asymptote. This idea is captured in a great article from a16z[12]. The authors, D’Arcy Coolican and Li Jin, talk about “network contaminants” – that is, incremental users who degrade the user experience for other users. Network contaminants weaken the network effects of a platform; this creates a situation where a platform can actually become less valuable as it continues to onboard new users, provided that those new users worsen the product/service for existing users.
Source: Bristlemoon Capital; a16z
Initially when Tinder was onboarding college students around campus, the network strengthened with each new user. This is because having more college students on the platform reinforced the value of that community by creating a larger pool of users who went to the same school and are also in close proximity. However, let’s take an extreme example and say that Tinder hypothetically manages to onboard every single person on planet earth. You’d have literally billions of people to scroll through. However, this is very much not a case of “the more the merrier”. For example, around 36% of the profiles encountered by a U.S. user would be from users located in China and India (based on their share of the global population size). This is not of great use if you’re looking to spontaneously meet up with that person for drinks the following night.
While in this extreme scenario Tinder will have reached maximum user liquidity, the user experience would diminish to a point where the app becomes unusable. The only solution would be better user profile curation. Alas, and here is the core of the issue: Tinder doesn’t have the best information to curate profiles and overcome the issues of network contaminants. Relative to other apps that collect more data during the sign-up process, Tinder is disadvantaged in its ability to efficiently connect users.
This potentially means users must wade through more profiles until they find users they swipe right on, an issue that worsens with greater user scale. Tinder could address this issue via a more rigorous approach to user data collection when they first download the app. However, greater friction during onboarding could also potentially hurt net additions which are already an issue, as we will explore.
The company on its 2Q23 spoke about the potential for AI to improve the user experience, with the company investing in AI capabilities to surface the right content to the right people in a bid to improve relevancy and user outcomes. From the 2Q23 result:
Match Group has activated several teams across our brands to begin working on applying the latest AI technologies to help solve key dating pain points. These teams have been able to rapidly develop new features, with a number of initial features expected to launch over the next two quarters. These include helping users select their optimal photos and leveraging AI to highlight why a given profile may be a good match. We're also working on larger AI projects that more holistically improve the end-to-end dating experience. We will share more about those plans as they progress.
CEO Kim expanded on this at the recent Goldman Sachs investor conference:
So even as recently as last night, I was like testing the Tinder AI photo selector. And it went through my 3,500 pictures on my phone, and it picked the top 10 most -- best pictures. I'm like, "Wow, that really does make sense. Me and a picture of my dog on the beach, that's a great photo." And I like -- initially, when I jumped into Tinder, I had no idea what photo to select. That's like a great example of something that you can see in code utilizing AI.
Management noted these AI features will begin rolling out in select markets in late August 2023. While it’s early days and scant details were provided, AI does hold the potential to improve the user profile curation capabilities of Tinder, a feat that would improve the user experience and could lead to a reacceleration in Tinder daily new users and average payers.
High levels of user churn
The second issue faced by Tinder is the inherently high level of user churn and the implications of this for the unit economics of the business when net adds begin to plateau, which is been the case for Tinder, with total payers lower than what they were from a year and a half ago. Ordinarily, products tend to retain more users as they get better. Dating apps, on the other hand, have a rather unfortunate conundrum regarding user churn: the more successful the dating app is in matching people with their ideal partner, the more users they should expect to lose. Put simply, when two users enter a relationship, they no longer require the app’s services.
For this reason, it’s actually a positive for Tinder’s unit economics to the extent that users engage in more casual dating behavior where they will continue to rely on the app. While Tinder does not disclose churn rates, we can make estimates around monthly churn rates and then what this implies for annual churn. This is in effect the rate at which your bucket is leaking, and the percentage of annual users you must replace with new or reactivated users to remain at the same level of revenue, all other things being equal.
Annual Churn = 1 - (1 - Churn Rate)^12
Source: Bristlemoon Capital
As we can observe, very small incremental increases in monthly churn cause a large increase in annual churn rates, which eventually moderates as the churn rates get larger.
Source: Bristlemoon Capital
Best-in-class consumer subscription apps run in a 2-5% monthly churn rate range. However, the abovementioned dynamics around successful Tinder users churning from the app means that this monthly churn is likely to be much higher. Remember, whenever Tinder is successful in facilitating a relationship, they lose two users. There are a couple of reasons why a Tinder user might churn from the service, with each scenario holding a different chance of recapturing that user down the track[13]:
A user might churn because they get low quality matches, get bored, experience technical issues, or face harassment. In this case there’s a low probability of reactivating that churned user.
People can churn because they enter a relationship, become exclusive, and are no longer in the dating market. There is a chance that they join the platform again if they become single or cease to be exclusive.
In attempting to estimate Tinder’s churn rate, we can look to Meetic, a French dating app that was acquired by Match Group. Meetic in a 2008 earnings press release made a useful disclosure on churn rates, noting that monthly churn for the Group’s Dating activity was in the low-to-mid-teens percentage range[14]. If we were to assume that Tinder has a 15% monthly churn rate, this means that around 86% of that initial user base is churning each year.
That’s astonishing. With those numbers, Tinder would be retaining a measly 14% of its users from the start of the year and would need to reacquire 86% of its user base each year. Now that doesn’t mean that Tinder needs to find new users which have never used the service before. Previous Tinder users can reactivate their profile by redownloading the app, and this sort of deleting and redownloading behavior is common as a user’s dating situation fluctuates. It does, however, mean that Tinder has a transient user base that oscillates in and out of using the app.
Here’s why the market has punished the Match Group share price so severely: Tinder’s stalling user growth indicates top-of-funnel issues that may be expensive to remedy. Historically, Tinder’s virality and rapid user growth meant that there was an influx of new users. Because of this, the high natural churn rates for the business were a non-issue. For example, as disclosed in the 2015 Match Group S-1, the company’s Dating business increased from 8 million MAUs in 3Q11 to 59 million MAUs in 3Q15 – a 63% compound annual growth rate that’s inclusive of churned users, implying even higher gross user additions. However, with the app maturing after being around for more than a decade, and with far more dating app alternatives than there were previously, incremental user growth is now harder to come by. The result is that it’s harder to refill the leaking user bucket with new users.
There are broadly two ways that Tinder can address this issue: 1) spend money on R&D to improve the product in a way that increases retention/attracts new users; or 2) spend money on sales and marketing to acquire new users. Both of those potential fixes require Tinder to spend money and they have negative implications for the business’s margin profile. Not only that, but when viewing customer acquisition spend (i.e., CAC) through the lens of the LTV/CAC equation, user retention issues can materially affect the user LTV. The potential for churn to eat away at Tinder’s LTV means that MTCH is potentially putting CAC dollars against a low-certainty, risky payback. High churn businesses aren’t necessarily bad if there’s a very low CAC (SHOP and DOCN are good examples of this). But to the extent that CAC is increasing – specifically, where a higher level of spend is required to onboard an incremental user – then that’s problematic for a naturally high churn business such as Tinder as it degrades the unit economics and hurts margins.
The flipside is that venture capital outfits, because of the difficulty in gaining confidence around LTV/CAC unit economics, are reluctant to write checks for dating apps. This has not been helped by a cooler funding environment than has existed in prior years. Counter-intuitively, to the extent that customer acquisition costs are rising, it makes the category less attractive to new entrants, more difficult and expensive to scale up new dating apps, and potentially solidifies the position of incumbent apps that have reached user liquidity. While this is not to say that a left-of-field dating app can’t still take the market by storm, it is likely that it will be significantly more difficult to achieve the viral, low-cost organic growth that Tinder did in its early days when the mobile dating app category was in its infancy.
The Match Group management team perhaps foreshadowed a greater willingness to spend against their flagship brands when they guided for “overall marketing spend to increase year-over-year in Q2, specifically at Tinder and Hinge with reductions in almost every other brand in the portfolio”. Match Group management tacitly admitted that they have underspent on marketing on the 2Q23 call, noting that they had been “less active than our peers from a marketing perspective for several years”. Tinder made a strategic error during the pandemic by failing to pivot its marketing and customer acquisition channels during the pandemic. The company’s historical reliance on word-of-mouth, particularly college recruiting, disappeared overnight during the pandemic lockdowns.
Bumble, on the other hand, leaned into out-of-home advertising, sponsorships and display advertising that online dating apps have historically shunned[15][16]. This investment in the brand has contributed to BMBL’s 60% increase in total paying users over the last three years, a stark contrast to payer performance at Match Group. This has important top-of-funnel implications – Bumble’s investment to reach users in the 18–20-year-old cohort as their initial dating app touchpoint will pay dividends as those users begin to age into being payers. To the extent that Tinder has underinvested in this cohort over the last few years and failed to capture share of mind relative to other dating apps, then the repercussions are felt on a lagged basis. It’s possible that the current bout of weak payer growth being faced by Tinder is a consequence of marketing blunders that occurred 2-3 years ago.
The problem here is that if Tinder now requires a structurally higher level of spend to maintain its user base and top-line, then the implication is that the business was overearning historically. It should also be highlighted that these CAC concerns are about Tinder’s future users; historically the increased word-of-mouth that accompanies a scaled app has actually caused MTCH’s CAC to decline. From the 2022 10-K: “As our mix has shifted toward younger users, our mix of acquisition channels has shifted toward lower cost channels, driving a decline over the past several years in the average amount we spend to acquire a new user across our portfolio. As a percentage of revenue, our costs of acquiring users have declined.”
Furthermore, these CAC-driven margin fears are juxtaposed against the current strategy of raising prices for Tinder (which we will cover below). These price increases are supporting management’s guidance for FY23 adjusted operating margins to be better year-on-year with “a path to at least 50 basis points of margin improvement” (upgraded from prior guide of flat to better year-over-year).
Reputational damage
The third issue at Tinder is the app has a reputation as being a “hookup” app, a problem worsened by the company’s failure in recent years to properly manage the messaging around the Tinder brand. In a 2017 Esquire sex study, surveying 1,000 men and women, 48% of respondents said they use Tinder for hooking up[17]. The gamified nature of dating apps and the ability to find new partners has bred a hookup culture, with Tinder in particular being stigmatized for facilitating this sort of behavior. The reputation is perhaps not undeserved, and it potentially dissuades females from using the app. Other reputational fallout for Tinder includes the Netflix documentary called The Tinder Swindler, as well as numerous cases of sexual assault and even murders that occurred following matches on Tinder.
Melissa Hobley, the Tinder CMO who joined in August 2022 after five years as the Global CMO of OkCupid, is spearheading a new global brand campaign to correct some of these negative perceptions about the Tinder brand. “When you don’t tell people who you are, then they will come up with that on their own,”[18] she said, commenting on Tinder’s reputation for being a hookup app only. This is despite data from Tinder showing that 31% of Gen Z members use the app to search for a long-term relationship. The brand perception is fixable but this will require putting marketing dollars against the group in a way that was not required when the early growth of Tinder was viral and based on word-of-mouth. Fortunately, Match Group appears to have rectified a period of management turmoil that disrupted a clear strategy around marketing and product decisions.
Management turmoil
According to a former Match Group employee, there has been a lot of management turnover over the last six years at the company:
So I think the first one is just internal alignment, so quite a bit of management turnover on the Tinder side, if you think about since 2017 when I joined, they've had four different CEOs, four different CPOs, three different CMOs, and times when actually the Chief Product and Chief Marketing Officer roles were vacant[19].
The problem with management turnover is it can create internal chaos and a lack of strategic alignment. This can be observed with the lack of product innovation at Tinder relative to competitors. For example, Bumble introduced in-app voice and video calling in June 2019. It wasn’t until October 2020 that Tinder rolled out “Face to Face”, its in-app video calling feature. Even other Match Group brands introduced these features far before Tinder did, with Hinge rolling out video calling in select markets in May 2020. On the 2Q23 earnings call, CEO Bernard Kim noted the glacial pace of product innovation, with the app remaining fairly similar over the last decade:
So if you actually look at Tinder today, it's really similar to the product that was launched 10 years ago. I tried the app when I was in Los Angeles about 10 years ago, and I tried the app today and it felt pretty similar. So what I've done is I've challenged the teams to make Tinder feel more vibrant and alive, going through like an overhaul and potential refresh of the product experience. What the teams were able to do creatively is to look at ways to bring more depth into member profiles and also keep that core experience intact.
There have also historically been cultural problems around Tinder’s autonomy within Match Group. Tinder retained an independent culture and was mostly allowed to do its own thing. There is a lot of accumulated knowledge in Match’s brands that by the accounts of former employees, was not adequately shared amongst other group brands to cross-pollinate these insights and benefit the Group as a whole. While Tinder historically acted as a quasi-independent company within the Group, Bernard Kim is now the CEO of both Tinder and Match Group, a development that likely helps Tinder shift away from its siloed approach. We are perhaps seeing early evidence of this with Tinder introducing weekly subscriptions in late 1Q23 and Hinge launching weekly subscription packages in early August 2023, following from the success of this tier at Tinder.
User demographic constraints
Tinder faces user demographic challenges. Firstly, 18–35-year-olds are its key age band. Similar to the churn discussion above, users age out of this band and typically stop using Tinder if they find a partner. While new users age into this cohort bracket, it does narrow the scope of Tinder’s addressable market. More importantly, however, is the fact that the users ageing into dating app users are Generation Z – that is, people born between the late 1990s and the early 2010s. A discussion with the Former Chief Communications Officer at Tinder indicated that around half of the people who use Tinder are under the age of 25. This is consequential due to the radically different approach Gen Z users take when dating.
Many of these users simply don’t see gender in the binary mode that has been the foundation of dating apps like Tinder. Rather, many Gen Z users view gender in non-binary terms, are more fluid in their sexual orientation, and because of growing up with digital tools, often blend their physical and digital realities in a way that makes them very comfortable staying online. While it’s unlikely that these differences are a large enough departure to turn Gen Z users off dating apps, Tinder must adapt its product to better cater to these younger users. Match is clearly aware of the Gen Z nuances and are making changes. From the 2Q23 earnings call:
Tinder has turned its attention to an important product refresh in 2H to better satisfy its core Gen Z audience. Gen Z is approaching dating differently than Millennials. They seek inclusivity as well as greater authenticity and more dimensionality. With this in mind, Tinder is testing a refreshed core experience that more directly caters to the expectations of today’s younger generation. Specifically, Tinder is seeking to make it easier to create and consume content with features such as prompts, quizzes, and conversation starters that enable deeper self-expression throughout the dating journey.
One positive takeaway, surely the envy of many consumer-facing businesses, is that the Gen Z group is a “core” part of Tinder, creating a fantastic opportunity for user longevity within the app.
The Future of Match Group
So far, the analysis has been mostly downbeat. It’s important to present a balanced perspective that notes, rather than omits, issues within a business. With that said, there are reasons to be optimistic about the future of Match Group. Let’s start with Bernard Kim, the Match Group CEO.
Bernard Kim joined Match Group in May 2022, replacing Shar Dubey who stepped down from the company but remained on the Board. Kim was the President of Zynga – the mobile video game developer – for the approximately six years between June 2016 and May 2022. Prior to Zynga, Kim was at Electronic Arts for nearly 10 years, where he was last the Vice President of Mobile Publishing. This experience within the video game sector, specifically freemium games, is notable as it relates to Match Group’s push to unlock value from so-called “whale users” – that is, users capable of spending significant sums on in-app purchases (IAPs). Dating apps, much like mobile games, follow a power law distribution whereby an inordinate amount of revenue is generated from a very small cohort of users. To illustrate just how extreme power laws can be, it’s instructive to look at disclosures from the Epic Games v Apple lawsuit.
In the trial documents the Court unsealed data about the distribution of revenues for Apple’s App Store for the third quarter of 2017[20]. This data is pure gold, and I’m sure Apple was very displeased at its unearthing. Astonishingly, 0.5% of people generated more than half of all App Store revenues (53.7%, to be specific). These super users, who were paying in excess of $450 per quarter each, represented a tiny fraction of the user base but generated the majority of spend.
Medium-spenders – users who paid between $15 and $450 per quarter – constituted 7.4% of all Apple accounts and accounted for 41.5% of all App Store billings. What this means is that 7.9% of Apple accounts generated 95.2% of all App Store billings. At the other end of the spectrum are non-paying users, with Apple disclosing that 81.4% of all accounts spent nothing and comprised zero percent of the App Store billings for that quarter. That’s pretty cool information. But the disclosures continued, drilling into the gaming portion of the App Store.
Source: Bristlemoon Capital; Epic Games v Apple Lawsuit Materials
Specifically for games, 6% of App Store gaming customers in 2017 accounted for 88% of all App Store billings and were gamers who spent in excess of $750 annually. The Court materials zoomed in further on this 6% gamer base. Incredibly, the top 1% of iOS gamers contributed 64% of App Store game billings and spent on average $2,694 per year.
Source: Bristlemoon Capital; Epic Games v Apple Lawsuit Materials
It certainly took some digging to find those materials, but they represent spend distributions for freemium apps at enormous scale (Apple has more than 2 billion active devices) and help frame the potential opportunity for Bernard Kim applying the mobile app playbook to Match. The opportunity for Match is to rework its pricing architecture to unlock the spend potential of the whales within its user base. What this means is that different features amongst the paid subscription tiers might need to be redistributed so that there’s a greater need for power users to spend on unbundled features to achieve their desired user experience. There is also potential to introduce a super-premium subscription tier which we will explore below. While this sounds nice in theory, there are some aspects of dating apps that hinder the comparison with mobile gaming, as well as put a ceiling on the spend potential of users. In the mobile gaming world, Bristlemoon learned of power users that would spend hundreds of thousands of dollars, and in extreme cases, millions of dollars per year within a mobile game. Dating apps are unlikely to carry the same potential for outsized monetization of these power users due to the double-opt in nature of dating app interactions.
If we consider the Bartle taxonomy of gaming player types[21], gamers will pay money via IAPs for convenience to progress through the game (Achievers), customization (Socializers), competitive advantage (Killers) and content (Explorers). The potential for value extraction in gaming is large due to the immense utility gamers derive from in-game content in terms of some mix between practicality and exclusivity. Planet Calypso, as an example, was purchased by a gamer for $6 million.
Source: TheGamer.com
The potential for such extreme value extraction in the world of online dating is limited by the fact that the utility from any expenditure is often dependent on the reception from the dating candidates the user is looking to court. Think of it this way: you could spend all the money in the world in Tinder but if no one likes your profile back then that spend creates minimal utility for the payer. Features such as Super Like or Boost are geared towards helping users get matches, but they cannot force the other user to like the paying user’s profile. For this reason, there’s a connection between the desirability of a payer as a dating candidate and the utility they are able to enjoy from their spend within the app. It is worth diving deeper into the dynamics of dating apps and the matches that occur within, particularly the fact that a small number of males capture the lion’s share of matches.
This fantastic YouTube video by Memeable Data runs a simulation of 1,000 hypothetical dating app users (500 men and 500 women) to understand why men get so few matches. The simulation was run 1,000 times. The analysis focuses on dating with opposite genders, noting that same-gender dating apps have very different dynamics that are outside of the scope of the analysis.
The simulation assumed that users see 100 profiles per day and that every profile is treated equally by the algorithm. Furthermore, users were assumed to like 1 out of 4 profiles they see. This means that every user has a 25% probability of being liked when their profile appears. Under these (hypothetical) assumptions, scenario 1 yields the following results.
Source: Memeable Data
This clearly does not depict the reality of dating apps. This is because there are more male dating app users than female users. Statista data shows that men vastly outnumber women on dating apps such as Tinder and Bumble.
Source: Memeable Data; Statista
When the simulation is rerun assuming that there are two men for every one woman on the app, there is a material difference in the result. The gender imbalance causes women to receive four times the number of likes and double the number of matches than men.
Source: Memeable Data
You might be wondering why the number of matches is not higher and in the range of 12 to 13 matches, given that they are liking 1 out of 4 profiles and received 50 likes. This is because there are now so many male users that the women don’t get a chance to see half of the users that liked them. Recall that users are seeing 100 profiles per day. This puts a volume cap on the number of profiles women see. The typical female user is bombarded with male profiles which can cause women on the app to feel overwhelmed by the amount of likes they receive. The advances from males can sometimes be aggressive, and this intrusive behavior can cause women to become even more selective around who they interact with on the apps.
The typical male on the apps, on the other hand, becomes less picky by virtue of likes and matches being harder to come by. This leads to them giving likes more generously (which aids monetization) to female users in a bid to improve their chances of getting a match. Data from a 2014 NYT article supports this: “men are nearly three times as likely to swipe “like” (in 46 percent of cases) than woman (14 percent)”[22]. A third scenario was run to capture this dynamic of men giving more likes than women by giving women a 14% like rate, and men a 46% like rate.
Source: Memeable Data
Women are getting an average of 92 likes and men only get 7. Given that men have a 46% like rate, this results in 3.2 matches on average. However, this is an average, and there is a distribution within such that a small number of males capture a large share of the total likes from females.
A post[23] from Aviv Goldgeier, Junior Growth Engineer at Hinge, touched on the fact that certain people get exponentially more attention than others: “while about half of all likes sent to women go to about 25 percent of women, half of all likes sent to men go to a much smaller segment – about 15 percent… So that’s the biggest problem men face on dating apps – the Brad Pitts of the world take the lion’s share of the likes from an already like-deficient sex.”
We can again look at an updated simulation to incorporate how the attractiveness of users can impact the number of likes they get. The simulation assumed a new distribution such that the top users received exponentially more likes, with the average probability of receiving a like remaining the same.
Source: Memeable Data
The averages in this new simulation will stay the same, but by adding a new metric, the median, we can observe that the median male actually receives zero likes. This is incredible, and in this simulation the top 10% of male users get 37 likes on average whereas the average male user gets between 0 to 1 likes on average. It is critical to understand these user dynamics as they have enormous implications for the potential for value extraction within a dating app like Tinder.
Source: Memeable Data
Source: Memeable Data
While attractiveness is obviously subjective, the most attractive candidates don’t need to spend money to get matches. Arguably they don’t even need to be on the apps altogether. However, as a user’s “attractiveness score” – a callous but necessary concept to represent the realities of dating app monetization dynamics – decreases, there is a higher likelihood that they will want to spend money to improve their chances of getting a match.
However, the degree to which they can procure an advantage within the app, measured by the matching rate they achieve, is determined by their own attractiveness as a dating candidate. Here’s the catch: the more that a male on Tinder requires paid features to garner an advantage – that is, because of their low attractiveness as a dating prospect to female Tinder users – the less likely those paid features are going to be effective in leading to interactions and dates.
This is different from the world of video games. The utility from spending in a video game is not inhibited by one’s level of skill. Rather, the less skilled a gamer is, the greater the utility they’re likely to derive from spending on in-game advantages. It is unfortunately the opposite case in the world of dating, and this caps the level of value that can be extracted from users.
It seems like a stretch to believe that users would be willing to pay extraordinary sums of money on Tinder if those transactions don’t lead to matches and dates. Here is the key bottleneck: the effectiveness of any spending requires interest and opt-in from the other user you’re seeking to match with. Because of this, there is a lot of potential for the utility from a male user spending on the app to be curtailed by a lack of interest from female users.
Source: Bristlemoon Capital
While the above might seem wholly negative, the analysis is more so attempting to show that outsized monetization of whales in a way that’s analogous to the abovementioned Apple App Store numbers is maybe unrealistic. However, there is possibly still scope to introduce a super-premium subscription tier that might enable greater value generation from the 0.5% top payers. Tinder is in the process of launching a high-end membership that’s tentatively been called Tinder Vault; the final pricing is not yet known but there have been rumors of this tier costing up to $500 per month.
At the recent Goldman Sachs investor conference in September 2023, CEO Kim commented on this initiative: “You mentioned our high-end subscription tier. The brand will be announced shortly, but that actually went into submission last night. So it's with Apple right now.” The feasibility of this super-premium subscription tier stems from observations Match Group has made following their July 2022 acquisition of The League. Within that dating app, the most expensive subscription tier charges around $1,000 per month.
Source: Healthy Framework
Let’s run the numbers on what a super-premium tier could mean for Match Group. In 2Q23 there were 10.5 million average total Tinder payers. If we assume that 0.1% of these payers are willing to spend a lot more (the 10,500 whales), then at a $500/month subscription (or $6,000/year), this group of power spenders would contribute around $63 million per year. However, we must also account for inevitable user churn. Let’s assume that users churn in and out of the service over the course of a year, such that the annual churn is 50% (this is all back-of-the-envelope). The whales are also upgrading to the super-premium tier from maybe Tinder Platinum, which costs around $30/month, resulting in $3.8 million of lost revenue (assuming those users are all on monthly packages).
For simplicity let’s say there is $30 million of additional revenues that has extremely high pull-through to earnings. There are basically no incremental costs to this growth which highlights the power of this capital light model when it is indeed growing. If you assume 95% incremental margins then the $30 million revenue from a super-premium tier results in $28.5 million of incremental operating earnings. This is a 3% boost to Match Group’s earnings power simply by introducing a new tier that can tap into the 0.1% of payers. The point about high incrementals brings us to another interesting aspect of the Match Group story: pricing increases.
Pricing-led growth is great if you can get it
Under CEO Bernard Kim, Match Group is changing its approach to pricing with the view to increase the average revenue per payer. CFO Gary Swidler summed up the situation in June 2023 at a TD Cowen Technology Conference when he said: “this is a bit of a catch-up. Tinder hasn't been optimizing price very effectively for the last little while. And so they're catching up now. And we'll continue to optimize. It's not a once-and-done.” Tinder has an opportunity to increase price, as well as to introduce new types of subscription tiers, such as weekly subscriptions, to convert more users to payers.
Source: Bristlemoon Capital
In 2Q23, Tinder’s direct revenue per payer (RPP) was $15.12. Bumble’s average revenue per paying user (ARPPU), on the other hand, was $28.21 in Q2, an 87% premium to Tinder. While there are differences in dating intent, demographics (notably age and income) and potentially geographic mix differences that may explain some of the delta, the large gap does signal an opportunity for Tinder to get traction with price increases. $15 per month is unlikely to be the upper limit on a user’s willingness to pay when there’s the prospect of meeting the love of your life through the app (or whatever else the user is looking for). Tinder has started increasing prices, but this has come at the expense of payers, which are expected to decline by a mid-single digit percentage in FY23 year-over-year.
In 2Q23, Tinder RPP grew at 10% YoY due to pricing optimizations and new weekly subscription packages. These price changes are coming into effect slowly (and slower than initially expected by the management team), such that roughly 50% of the U.S. payer base is now paying the higher prices. Payers do not get hit with the higher prices until they churn out and redownload the app, or if they’re completely new Tinder payers. This takes some time for the price changes to roll through the payer base, meaning that we will see the wraparound benefit of price increases for the next few quarters.
The Match Group CFO guided for accelerating increases in RPP in Q3 and Q4 of 2023, noting that “[w]e are adjusting prices pretty meaningfully”. It was also encouraging to find that many payers that churn due to the higher prices are remaining in the ecosystem: “We have not seen any notable ecosystem detriments, as the Payers lost generally remain active on the platform and continue to send and receive likes and messages as non-paying users.”
Disclosure by the company around Tinder average direct revenue per day was very bullish, showing a marked acceleration since February 2023.
Source: Company filings
Management was guiding for close to 10% YoY Direct Revenue growth for Tinder in 3Q22 and are confident that Tinder can hit double-digit Direct Revenue growth in 4Q23. We were given an update at the recent Citi investor conference, with the MTCH CFO saying that Tinder revenue growth was going to hit 10% in 3Q23, a quarter earlier than previously expected. The one caveat to this impressive turnaround in the Tinder financials was non-U.S. price elasticity. The read-through from the below comments on the call, justifying why Tinder didn’t increase prices in non-US markets, is a negative for the price-led growth narrative that underpins the bull case for MTCH.
So we did test our pricing in the U.K., Canada, Australia, EU and Japan. And we did not see the revenue benefits that we saw in the United States. Part of this was due to that these markets were already priced competitively…The reality is that the U.S. actually hadn't adjusted prices for quite some time, so there wasn't as much room for optimization versus where we were in international markets.
It likely signals a limit to how far Tinder can pull the pricing lever, at least in the short run and in the absence of any product changes that can unlock spend. One change that is unlocking incremental dollars is the introduction of a weekly subscription tier, with Tinder “benefitting significantly” from this subscription option. From the 2Q23 call:
There has been significant demand from new users for these shorter duration packages, which are leading to meaningful lifts in conversion, resubscription rates, and renewal rates, particularly among female users, especially younger female users.
The data below is quite incredible as it relates to the conversion uplift for UK female Tinder users around the time that weekly subscription packages were rolled out in the U.K. A 73% uplift in the 18–25-year-old age cohort is simply extraordinary and potentially unlocks more of the market that can become paying users (provided that these users can be retained, and management did caution investors around “short-term volatility around our payer numbers” and potential churn arising from these shorter duration subscription packages).
Source: Company filings
Data from Yipit shows that around 19% of total Tinder subscribers had converted to weekly subscriptions in May 2023, increasing rapidly over the two months prior to that. As a point of contrast, weekly subscribers account for around 35% of total Bumble subscribers. This signals that there is still plenty of headroom to expand the penetration rate of weekly subscribers and convert more non-paying users to payers.
Hinge – stealing the show
So far we have devoted barely any attention to Hinge, the rising star of Match Group’s portfolio of brands. In 2Q23, Hinge generated $90.3 million of revenue, comprising 11% of Match’s total revenue. The brand is growing like a weed: Hinge achieved 35% YoY revenue growth in 2Q23 which expected to accelerate. With guidance for $400 million of Hinge Direct Revenue in FY23, it implies a greater than 50% YoY Hinge revenue growth exit rate in Q4.
When a small business within a large business is growing rapidly, it is often worth modeling the various segments separately to capture this mix effect. To illustrate the power of a high growth rate, despite the much smaller revenue base of Hinge, it contributed almost the same incremental YoY dollars as Tinder in 2Q23 (i.e., $23.2 million for Hinge vs. $25.7 million for Tinder). We are actually at an interesting fulcrum point where the share of total MTCH revenue growth in future years will tip more heavily toward Hinge.
As we can see in the pro forma estimates below, if Tinder is growing at c.4% per annum and Hinge at 34% per annum, then in less than five years, Hinge will be driving >80% of total MTCH group revenue growth (compared to 56% in FY22). Tinder, on the other hand, will likely dwindle in importance to the Group, contributing a mid-teens percent share of total revenue growth (vs. 70% in FY22). As a result of this growth, in FY27 Hinge would come to represent 28% of MTCH’s total revenues (vs. 11% in 2Q23), compared with 48% of revenues coming from Tinder.
This modeling exercise, while admittedly crude and destined to be inaccurate, is useful in helping visualize what the business might look like in the future due to materially different segment growth rates. Often the sell side while fail to appreciate the importance of a small, but rapidly growing business segment until it’s been disaggregated by management in the reported financials and begins adding to near term EPS estimates. With management beginning to report Hinge revenue growth on an ongoing basis since 1Q23, this will make it easier for investors to break out this revenue stream in their models and better reflect its value in their assessment of MTCH.
Source: Bristlemoon Capital; Company filings
Hinge as of mid-2023 was in just 20 countries[24]. Tinder, as a point of contrast, is in around 200 countries[25]. There is an enormous geographic greenfield expansion opportunity for Hinge and management is bringing the app to new markets. In March 2023 Hinge was a top three most downloaded dating app in many of these growth markets such as Germany and the Nordics. From the 1Q23 earnings call: “Having grown to over one million Payers primarily in English-speaking markets, we're now seeing terrific momentum in Europe and are continuing to invest to expand Hinge globally”.
It is this geographic expansion that should help underpin robust Hinge user and payer growth for many years to come. Furthermore, the fact that people tend to use multiple dating apps concomitantly reduces the risk of Hinge cannibalizing the highly profitable core Tinder business. From the 1Q23 earnings call:
[I]t is important to keep in mind that many singles are using, on average, three to four dating apps at any given time. In fact, based on an assessment of consumer survey data, we believe the vast majority of Tinder users who try Hinge remain active on Tinder, suggesting that Hinge usage is incremental as opposed to cannibalizing Tinder. Further, we estimate that approximately 10% of Tinder lapsed users are on Hinge.
It seems probable that Hinge will grow not only in terms of its financial impact on the MTCH business, but also in terms of the investor mindshare and discussion it receives.
Upside optionality from App Store fee changes
App store fees have been a major gripe for MTCH. Consider this: between 2014 and 2022 Tinder’s revenue grew by 3.6x, yet the gross margin sank by 16.6 percentage points, declining from 86.5% to 69.9%. That isn’t how a scaling internet business’s gross margin progression is meant to look like. The reason is an inability to leverage the in-app purchase fees, which is a key component of MTCH’s COGS.
MTCH noted in their 2022 10-K that “the percentage of our revenues paid to Apple and Google continues to be a significant and growing expense”. We can look at the YoY COGS change resulting from in-app purchase fees, and then calculate the incremental cost margins of these fees (that is, the incremental IAP fees relative to the incremental revenues they help produce).
Source: Bristlemoon Capital; Company filings
From the information at hand, we can see that IAP fees have in some years materially eaten away at incremental MTCH revenues. Over the past six years, MTCH has paid out 25 cents on average to app stores from every incremental dollar of revenue. This has contributed to poor incremental gross margins that have dragged down overall GMs. However, sales & marketing expense over the same 2014-2022 period was an almost 21 percentage point source of margin release. This is bizarre for an internet business, given that you’d typically see the exact opposite. Increased scale usually brings about gross margin expansion, while marketing expense leverage lessens to the degree that the marginal user is harder, and thus more expensive, to attract to the app.
The gross margin drag from fees paid to app stores makes it unsurprising that Match Group is heavily involved in pursuing antitrust actions against both Google and Apple, the owners of the two biggest app stores. For example, Match Group provided a testimony at the U.S. Senate’s app store antitrust hearing in April 2021. There are three ongoing developments worth noting as they relate to the potential for app store fees to be lowered: 1) the passing of the Digital Markets Act (DMA); 2) the Epic v Apple litigation; and 3) the Google Play Store antitrust trial.
The EU passed a law called the Digital Markets Act (DMA) in late 2022 which essentially says that the app store fees need to be fair and nondiscriminatory. Apple and Google meet the requisite criteria under the DMA to be deemed “internet gatekeepers” and fall within the ambit of the Act which is now in effect. Penalties for non-compliance are severe: fines can scale up to 10% of global annual turnover for non-compliance with the obligations of the DMA.
The key development is that the DMA requires that app stores do not block sideloading nor require developers to use their own services (most notably, payment systems). Apple and Google will need to comply with these regulations which could see fee relief for MTCH in the EU at some point over the next few quarters. There’s the possibility that this legislation catalyzes broader app store fee relief. MTCH CFO Gary Swidler made the following comments on the 1Q23 earnings call:
when you sort of factor all this in with all these different changes and things going on in all these different jurisdictions, I think what it means is the app stores have to ask themselves a question, which is, are they going to respond to these changes in a piecemeal basis and have different policies and fee structures and approaches in different markets? Or are they going to have one global policy that addresses all of these really significant and valid concerns and change app store policies to reflect a more fair app store ecosystem for consumers?
The next point is around the Epic v Apple litigation. Swidler commented on the 1Q23 earnings call that while he didn’t know specifically if the Epic-Apple case would result in app store fee relief, he said “it’s very possible”. On the same call, following the Epic Games v Apple appeal in the Ninth Circuit, Swidler mentioned that “we're increasingly hopeful that we'll be able to promote less expensive payment methods with improved customer service to our users in the not-too-distant future.” Three weeks later, Swidler made the point at the J.P. Morgan Global Technology Conference in May 2023 that the FY23 margin guidance assumes app store fees remain the same, “but I think that's not particularly likely. And so there's real upside potentially from there, too, depending on where we shake out on app store fees.”
Lastly, MTCH joined forces with Fortnite maker Epic Games, and over three dozen state attorneys general, to pursue antitrust action against Google, accusing the company of unfairly leveraging its market dominance and hurting competition via its Google Play Store terms and practices. This case will proceed to a jury trial on November 6, 2023[26], and provides a catalyst for potential app store fee relief. This could have a very material impact on company margins that creates an upside asymmetry for what MTCH might be able to generate by way of earnings.
In recent years both Google and Apple have made cuts to their app store fees. In November 2020, Apple announced that developers with less than $1 million in revenue would pay 15 percent to the Apple App Store instead of 30 percent. Google used to charge 30 percent for the first year of a subscription purchased through the app, but they reduced this rate to 15 percent in 2021. It is possible that there are further cuts to these fees, and this would be highly material for MTCH, given the very high proportion of app-based transactions (it was noted on the 4Q21 call that for Hinge, most payers use iOS and MTCH pays a full 30% fee rate on that revenue).
On the 4Q21 earnings call, management guided for $650 million of App Store fees in 2022. It was then noted in 1Q22 that there would be an incremental $42 million app store fee headwind for the seven remaining months of the year (implies $72 million annual run rate impact) due to Google moving forward with its requirement of mandatory use of its payment system. The original $650 million guidance did not include this incremental Google policy change impact. However, in May 2022 Match Group and Google reached an agreement that saw Google make a number of concessions, including guarantees that Match’s apps won’t be rejected or removed from Google’s app store for offering alternatives to Google’s billing system[27]. As such we will assume that MTCH paid around $650 million in app store fees in 2022. This equates to 20% of revenues and 68% of COGS in FY22.
We must then attempt to figure out the mix between subscriptions and a la carte purchases (given Google charges a lower 15% fee on subscriptions) as well as the iOS and Android mix of revenues. On the 3Q21 call, it was disclosed that about 70% of MTCH’s revenue comes from subscriptions. While this subscription percentage mix might have moved higher recently due to the introduction of weekly subscriptions, we will use this number to disaggregate IAP fees by subscription and a la carte. It was also noted that approximately 80% of MTCH’s IAP fees go to Apple, implying that Google captures the remaining 20% of IAP fees. Using these numbers, we can then ascertain that there is around $585 million of IAP fees that are most exposed to fee relief.
Source: Bristlemoon Capital; Company filings
We can look at a number of scenarios to calculate the potential earnings impact in the event that app store fee reductions transpire. MTCH’s adjusted operating income excludes stock-based compensation expense and, weirdly, depreciation. As such, Bristlemoon uses its own adjusted earnings that nets out these line items. If we assume flat YoY adjusted operating margins, it gets us $938 million of AOI in FY23. Any fee concessions drop straight through to the bottom line. In the event that app store fees were halved, the reduced COGS would boost FY23 adjusted operating income growth by a whopping 33 percentage points. Furthermore, it would result in an 8.6 percentage point step up in MTCH’s operating margins.
Source: Bristlemoon Capital; Company filings
These sorts of asymmetric upside boosts to earnings can act as the icing on the cake for investment opportunities. The sell-side is often loath to give credit to this potential upside in their earnings estimates due to the uncertainty and difficulty in handicapping the odds of app store relief being given. Instead, we would likely see a swath of EPS upgrades in the event that fee concessions were granted. While you wouldn’t want IAP fee relief to be the linchpin of your investment thesis, its value should not be ignored and developments on the app store fee topic should be closely monitored.
Valuation
We have covered a lot of ground and are now in good stead to look at the valuation implications for MTCH. The company generated $796 million of FCF in FY22 (adding back the $320 million impairment of intangibles that occurred in the period), putting the company on a 6% trailing FCF yield. However, the key question is what will the future FCF per share growth profile look like, and what is an IRR that we can comfortably underwrite?
We touched on the revenue mix effect of Hinge growing rapidly within the group. MTCH should be able to achieve high-single digit revenue growth going forward, supported by:
Tinder payer growth stabilizing in 2024 and remaining flat thereafter.
Tinder RPP growing at 10% in FY23 before tapering down to a 3-5% growth band going forward.
Hinge payers growing at 25% per annum over the next few years.
Hinge RPP growing at 7% per annum.
With this, MTCH should be able to achieve $4.6 billion in revenue in FY27. With Hinge rapidly increasing its scale and becoming less of a drag on group margins, as well as Tinder continuing to grow with pricing-led growth, we expect margins to expand from here. If you assume 50 bps per year of operating margin expansion, then we could see MTCH hitting 31.5% EBITDA margins in FY27 (Bristlemoon adjusted numbers which include SBC expense, hence the difference to current AOI margins). This implies roughly $1.45 billion of FY27 EBITDA. MTCH has achieved a c.92% EBITDA to FCF conversion rate over the last 5 years.
Source: Bristlemoon Capital; Company filings
If we assume that the historical levels of FCF conversion prevail, then MTCH should be generating around $1.34 billion of FCF in FY27. The missing piece to derive a future FCF per share estimate is the shares outstanding. MTCH is not a capital-intensive business by any stretch. In fact, it’s extremely capital light. MTCH has spent a cumulative $386 million in capex over the last decade (equal to just 12% of FY22 revenue of $3.19 billion) and in some years capex is actually less than depreciation. The business requires minimal capex and working capital to fund its growth. The corollary of this is that reinvestment opportunities are insufficient to absorb all the earnings MTCH is generating (the company is wildly profitable, despite some of the negative investor perceptions toward the stock). This creates share buyback opportunities (which historically was not always the case, given the company suspended its buyback program when it delevered from 4.5x to 3x net leverage post the IAC spin).
MTCH has a $1 billion share repurchase authorization, of which there is $967 million remaining as of 2Q23. The company expects to exhaust this authorization over the next two to three years. The company had 277.8 million shares outstanding as of June 30, 2023. CFO Gary Swidler has spoken about MTCH’s intention to return at least half of the FCF generated by the company over the next few years back to shareholders in the form of “buybacks or some other way”. Swidler revealed at the Citi investor conference in September 2023 that MTCH had bought back $300 million of stock in Q3 2023 quarter-to-date, the equivalent of around 2.5% of MTCH’s current market capitalization.
Over the next five years, we see MTCH generating a cumulative $5.6 billion of FCF (around 43% of the company’s current market capitalization). While difficult to estimate due to its dependance on share price movements, we think that MTCH could buy back 3.5% of its shares outstanding per annum (assuming the earnings multiple remains constant). Under these conditions, MTCH would be retiring around 17% of its current shares outstanding over the next five years. As a shareholder, you can sit back and do nothing and these buybacks will increase your share of the business by 20%! This means that we could see FCF per share of around $5.80 in FY27. If the market was willing to capitalize this at 15x, then you’d get $87 per share of value. This is a 14% IRR and almost 2x multiple of money over the five-year period for a fairly undemanding set of growth assumptions.
We can also envision a more bullish scenario where MTCH achieves mid-teens percent revenue growth, supported by continuing to pull the Tinder pricing lever, as well as rapid expansion in payers and RPP at Hinge. Under this scenario you could see a mid-single-digit growth rate from non-Tinder and non-Hinge brands. The margin increase would also be in this scenario and could see MTCH margins conservatively improve by 100 bps per annum. In this scenario MTCH would generate $2 billion of EBITDA in FY27, converting to almost $1.9bn of FCF. In this bull case MTCH would generate $8.2 per share of FCF, which, if capitalized at the same 15x, would result in a $122 share price. This is a 22% IRR and 2.7x multiple of money. If we layer on the event where app store fees fall by halve to 15%, EBITDA margins explode to 46.5%. This super bull case results in a 31% IRR and 3.8x multiple of money over the 5-year period.
But what if things go awry? Let’s say that Tinder is indeed a melting ice cube and revenue falls by low-single-digit percent over the next five years. Hinge also runs out of steam and grows at a mid-teens percentage rate (compared to the 35-40% growth rates it’s currently achieving). Under this draconian scenario, MTCH revenue growth would be in the low-single digit percent range. Let’s say that margins contract by 100 bps per annum as customers become more expensive to acquire. In this scenario, MTCH would still be generating around $3.3 per share of FCF in FY27. The market might be willing to capitalize this at 10x, resulting in a $33 share price. If this event transpires, we will have a -6% IRR and have impaired our investment by 28%. This is obviously not good, but a lot would need to go very wrong in the business for this scenario to eventuate.
Thanks for reading the inaugural Bristlemoon Capital article on MTCH. We hope to post many more of these writeups. If you enjoyed this analysis and got value out of it, please subscribe and share this Substack link on social platforms such as Twitter (X).
[1] The initial approach to data gathering by Match.com was haphazard, with the categories of interests and attributes becoming voluminous and at times intrusive. There was at one point 75 categories of questions, including one that was devoted to sex and prompted users to list their specific interests and fetishes. With the guidance of a much-needed female member who joined the team as the Director of Marketing, Fran Maier, Match.com walked back many of these jarring questions and consolidated the categories in a way that was conducive to attracting more female members to the site.
[2] https://www.foxbusiness.com/features/timeline-how-match-com-got-where-it-is
[3] As a piece of trivia, Match.com Co-Founder Gary Kremen had a dispute with investors, and departed from the Group in 1996, walking away with just $50,000.
[4] For the last twelve months in the U.S., per Match Group internal survey (October 2022).
[5] Per Sensor Tower for last twelve months ended March 31, 2023.
[6] https://techcrunch.com/2011/03/31/exclusive-iac-hatches-hatch-a-technology-sandbox-to-incubate-mobile-startups/#:~:text=Hatch%20Labs%20is%20the%20brainchild,all%20product%20strategy%20for%20mobile.
[7] https://techcrunch.com/2015/01/12/tinder-acquires-ephemeral-messenger-tappy/?guccounter=1&guce_referrer=aHR0cHM6Ly93d3cuZ29vZ2xlLmNvbS8&guce_referrer_sig=AQAAANZq3UVoJZkUhhBoSLQ6y5MKb0FC2TkVKosSAjvQIYMANK9p2826YhiRYguFWguvv9xAa3nGZQLyFII9KlnX6RHKDWvTtR6ejZZ0flZYx7kud8rTbWJzhcAqsdoPN4-2gUrWYxIJuKppn23u4FDRO1kqjGj8AO7nJTr3u_CSRpu_
[8] https://www.nytimes.com/2014/10/30/fashion/tinder-the-fast-growing-dating-app-taps-an-age-old-truth.html
[9] https://www.nytimes.com/2014/10/30/fashion/tinder-the-fast-growing-dating-app-taps-an-age-old-truth.html
[10] https://www.insider.com/tinder-number-1-grossing-app-app-store-2017-9
[11] Tegus. Former Director of Corporate Strategy, Match Group Portfolio at Match Group [call date 28 April 2023].
[12] https://a16z.com/2018/12/13/network-effects-dynamics-in-practice/
[13] https://amplitude.com/blog/tinder-dating-app-retention-paradox
[14] https://www.meetic-europe.com/press/de/neu/2008-annual-revenue-e133-7m-successful-launch-of-meetic-affinity/
[15] https://www.oma.org.au/news/bumble-finds-way-love-lockdown
[16] https://www.impactplus.com/blog/bumble-dating-app-coronavirus-covid-benches-marketing
[17] https://www.esquire.com/lifestyle/sex/a57025/the-great-esquire-sex-study-infographic/
[18] https://mumbrella.com.au/tinders-new-brand-campaign-seeks-to-correct-the-record-on-modern-dating-says-global-cmo-783696
[19] Tegus. Former Director of Corporate Strategy, Match Group Portfolio at Match Group [call date 28 April 2023]
[20] https://regmedia.co.uk/2021/09/10/epic-v-apple.pdf
[21] https://en.wikipedia.org/wiki/Bartle_taxonomy_of_player_types
[22] https://www.nytimes.com/2014/10/30/fashion/tinder-the-fast-growing-dating-app-taps-an-age-old-truth.html
[23] https://web.archive.org/web/20190719163307/https://hingeirl.com/hinge-reports/whats-the-biggest-challenge-men-face-on-dating-apps-a-qa-with-aviv-goldgeier-junior-growth-engineer/
[24] https://hingeapp.zendesk.com/hc/en-us/articles/360011044113-Where-can-I-use-Hinge-
[25] https://www.help.tinder.com/hc/en-us/articles/360051023792-How-do-I-change-my-language-settings-on-Tinder-#:~:text=Tinder%20is%20available%20in%20190,com%2C%20please%20continue%20reading%20below.
[26] https://techcrunch.com/2023/01/19/epic-and-matchs-antitrust-case-against-google-heads-to-jury-trial-on-november-6/
[27] https://www.wsj.com/articles/match-group-google-reach-deal-on-app-store-payment-rules-11653049794
Disclaimer / Disclosures
The information contained in this article is not investment advice and is intended only for wholesale investors. All posts by Bristlemoon Capital are for informational purposes only. This article has been prepared without taking into account your particular circumstances, nor your investment objectives and needs. This article does not constitute personal investment advice and you should not rely on it as such. This document does not contain all of the information that may be required to evaluate an investment in any of the securities featured in the document. We recommend that you obtain independent financial advice before you make investment decisions.
Forward-looking statements are based on current information available to the author, expectations, estimates, projections and assumptions as to future matters. Forward-looking statements are subject to risks, uncertainties and other known and unknown factors and variables, which may affect the accuracy of any forward-looking statement. No guarantee is made in relation to future performance, results or other events.
We make no representation and give no warranties regarding the accuracy, reliability, completeness or suitability of the information contained in this document. To the maximum extent permitted by law, we do not have any liability for any loss or damage suffered or incurred by any person in connection with this document.
Bristlemoon Capital Pty Ltd (ABN: 22 668 652 926) is an Australian Financial Services Licensee (AFSL Number: 552045).
George Hadjia is associated with Bristlemoon Capital Pty Ltd. Bristlemoon Capital may invest in securities featured in this newsletter from time to time.

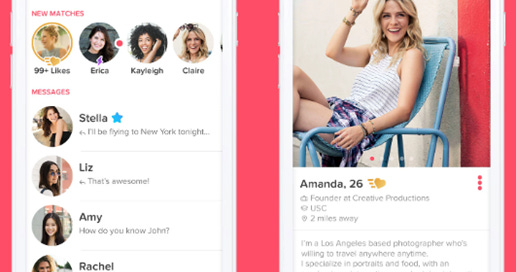


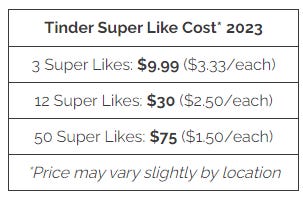


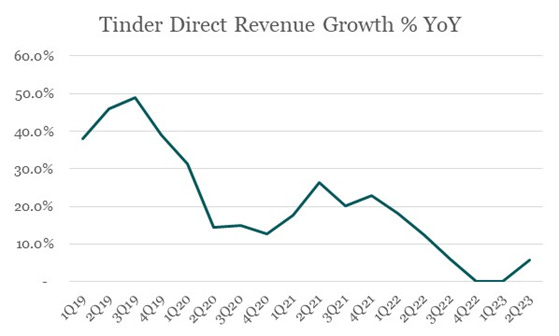
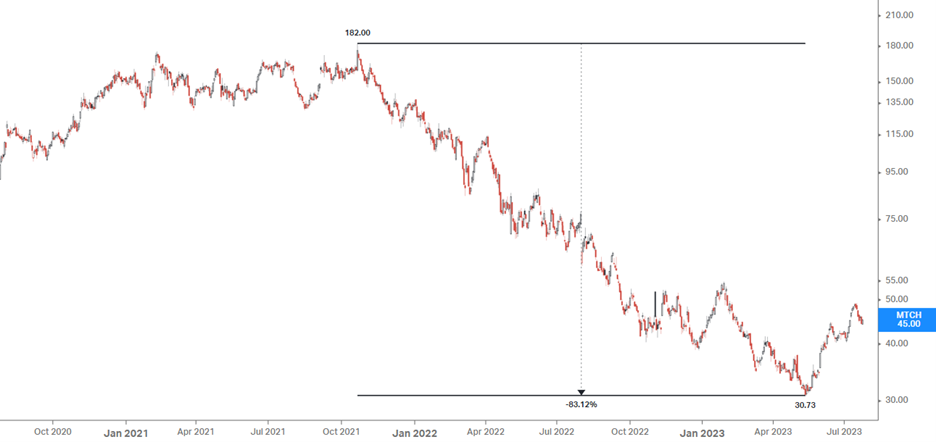


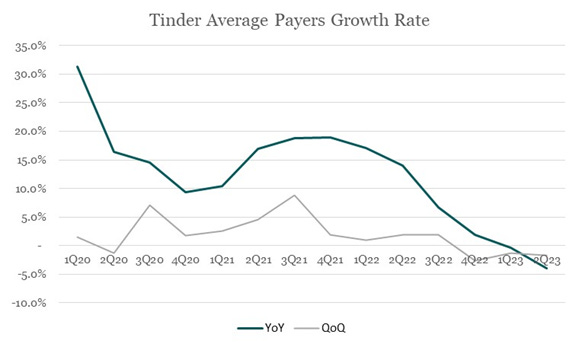
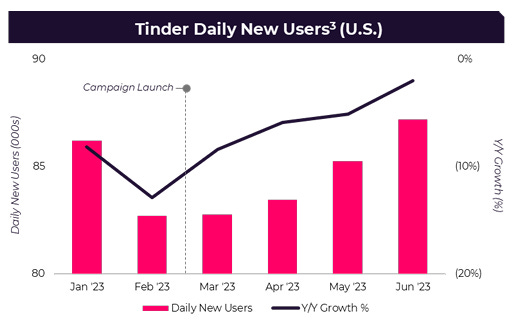
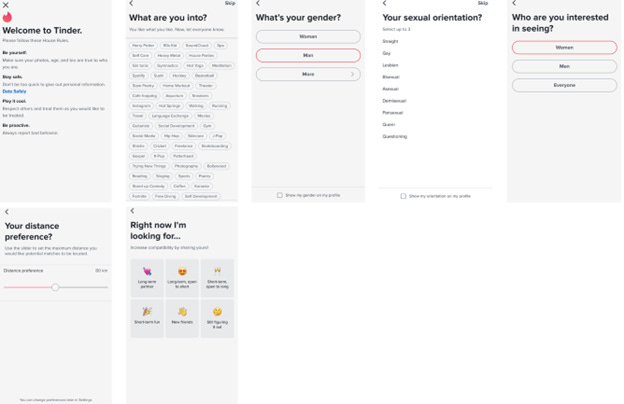
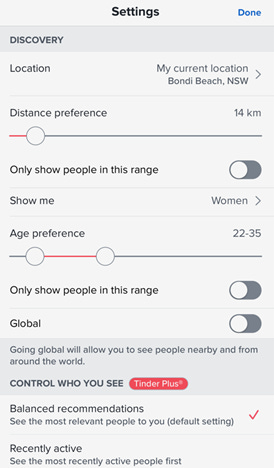


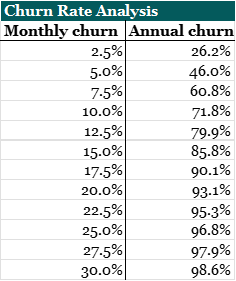
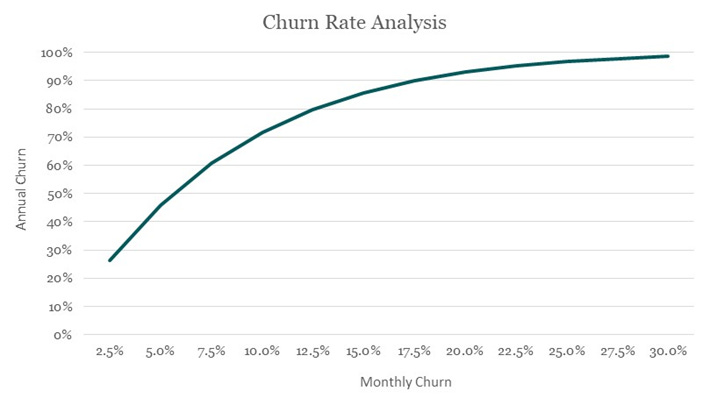


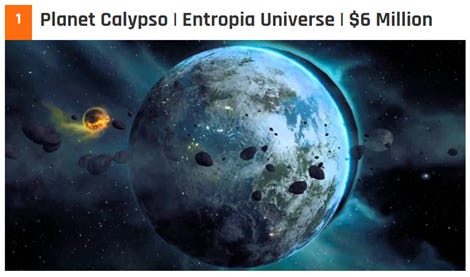


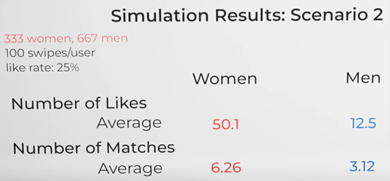
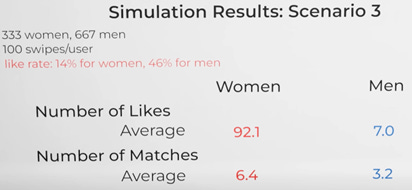
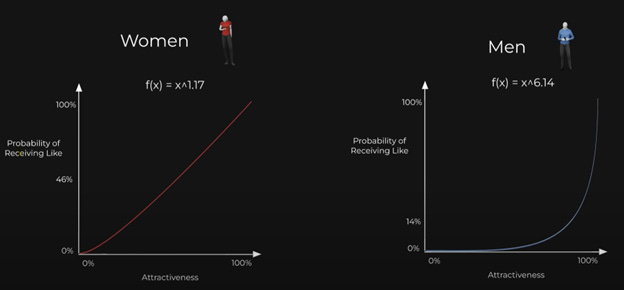

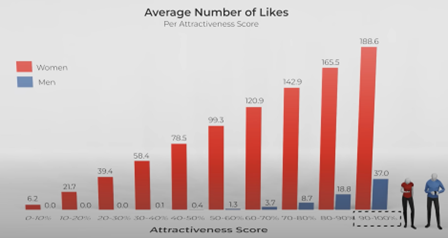


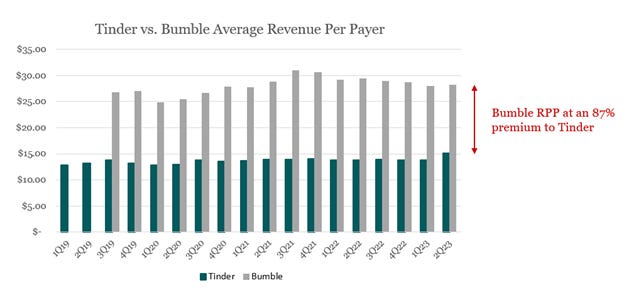
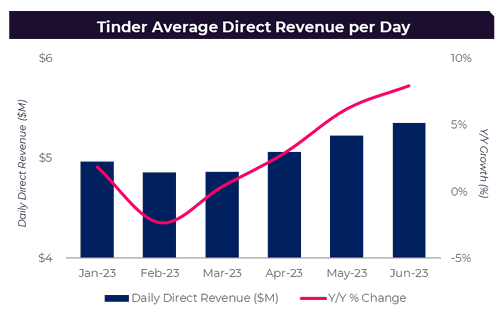
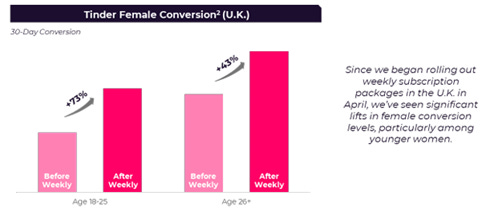
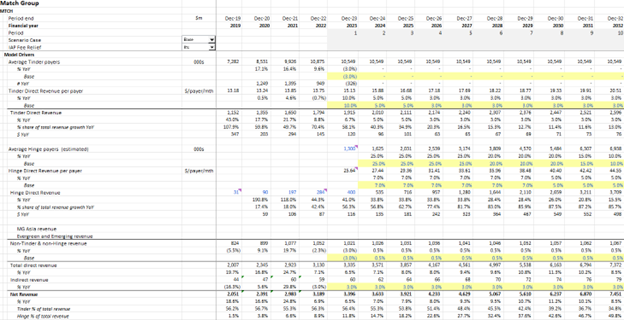
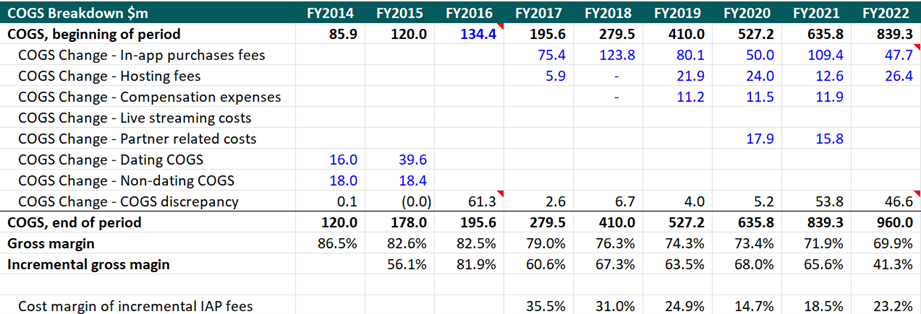


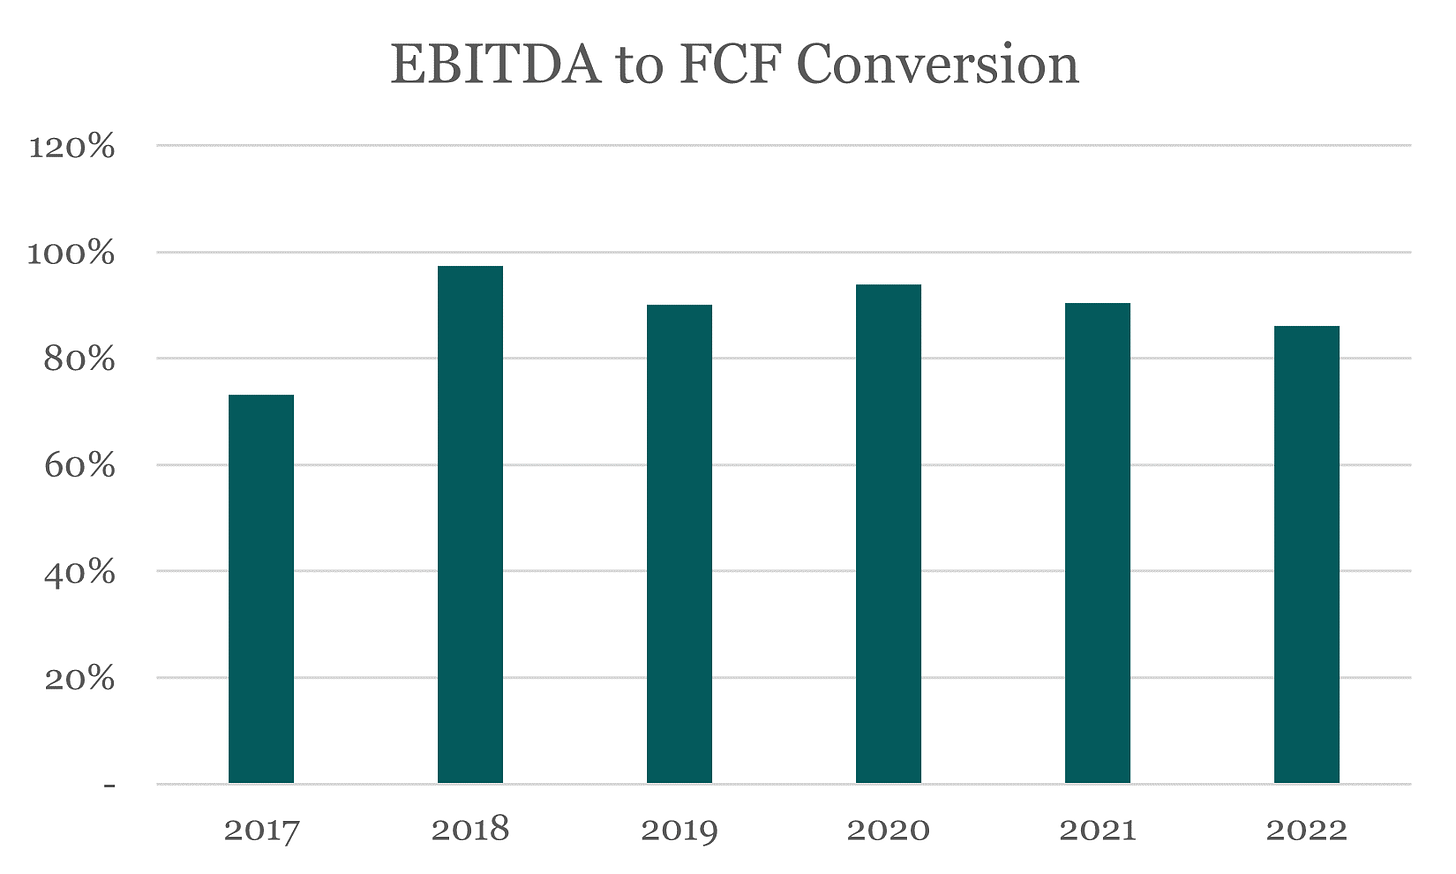
I feel it is important to deduct the SBC from the FCF estimates. In the bear case FCF per share should be lower after deducting SBC.
Great article - but one fundamental question that I have, is - how do we know whether this business follows the power law (with whales) or generates most of its revenue from its regular subscriber tiers? My rough math based on using North America ARPP of ~$20, suggests a 60-40 split between Tinder plus and the rest (assuming everyone is on the 6 month plan; if not it would skew further toward Tinder plus and not Gold/Platinum, which suggests the opposite of the whale theory.